
“Is the blend homogeneous? Is the drying finished? Has my emulsion stabilised? Does this drum really contain what the label says?” Four questions settled during manufacturing.
The laboratory remains the reference; the model is built and checked on its value.
Where you meet it: drying grain and forage, polymer sorting, drying a pharma granule.
The essentials in four points
- Identifies and quantifies the organic molecules that carry hydrogen — the C–H, O–H and N–H bonds.
- Also sees the physical state: particle size, compaction. An asset for a physical property, something to keep in hand for a content.
- Solids, powders, pastes, liquids, suspensions and emulsions, where the material sits, with no preparation, in a few seconds.
- Reference texts: in pharma, Ph. Eur. 2.2.40 and USP ‹856›; outside pharma, ISO 12099, ASTM E1655 and D6122.
How the measurement works
Light enters the material instead of stopping at its surface, in diffuse reflection or in transmission, with no preparation or dilution. The spectrum therefore depends as much on the light’s path as on the chemistry: particle size and compaction change it with the composition unchanged.
Where the instrument sits
Typical applications
Moisture content
End of drying, residual moisture, distribution across the batch.
Content uniformity
Blend homogeneity, and the point at which blending stops.
Identity on receipt
Container by container, often through the packaging.
Composition of a liquid
Reaction progress, emulsion stability, dry matter of a suspension.
Monitoring an operation
Following a trajectory and deciding on a stopping point.
Bioproduction media: see NIR-HPTLS. Where selectivity comes first: transmission MIR.
Which bonds give the signal
A chemical bond vibrates at a frequency of its own, and the fundamental absorptions of those vibrations sit in the MIR. NIR sits higher in energy, where what appears are their overtones, the vibration excited at twice or three times its quantum, and their combination bands, where two vibrations add.
Those bands belong almost entirely to C–H, O–H and N–H bonds: water, alcohol functions, amines and amides, the carbon skeleton of organic molecules. A matrix carrying hydrogen is what gives NIR a signature, and that is verified before any project.
Identity card of the technique
| Criterion | NIR |
|---|---|
| What the measurement sees | The overtones and combination bands of the fundamental vibrations. Almost only the C–H, O–H and N–H bonds: a hydrogen-bearing matrix is required. |
| Selectivity | Low. Broad, overlapping bands; two grades of one excipient can give nearly superposable spectra. |
| What interferes | Water, before anything else. On a solid, particle size, compaction and hardness shift the baseline as much as a content does; on a liquid, that role falls to bubbles and temperature. Through plastic packaging, the plastic’s spectrum adds to the product’s: it is subtracted or built into the model. |
| Sample presentation | No preparation. In diffuse reflection on a divided solid, through glass or quartz, with a large area reachable by moving the sensor or the product — stream, conveyor belt, blender. In transmission or transflection on a liquid, a suspension or an emulsion, through an immersed probe or a cell on a bypass. |
| What the model requires | A chemometric model. Supplied ready to use for raw material identification on handheld instruments, and on request in agriculture and food; otherwise calibrated on your matrix and your reference method. |
| Reference texts | In pharma: European Pharmacopoeia 2.2.40. At the USP, ‹856› has carried the requirements since 1 November 2020; ‹1856› is its informational companion. Outside pharma: ISO 12099 for animal feed, cereals and milled products; ASTM E1655 to build the calibration, ASTM D6122 to validate an on-line analyser. |
What it asks of you sits beyond the instrument
A spectrum holds a curve rather than a value. Between that curve and 2.3 % water sits a model, and the model is what has to be built, validated and maintained.
Save in particular cases, that model is a model calibrated on samples. The spectrum is regressed onto laboratory reference values, by partial least squares or on principal components. Decomposing the spectrum onto pure components belongs elsewhere: in a real product, band intensity follows the matrix, the compaction and the particle size as much as the concentration. Pure-component model or model calibrated on samples: what each costs, and when each is legitimate.
- A reference method fixed and written before the first acquisition. The model learns to reproduce a laboratory method, and it stands on the quality of that method.
- A representative population of samples: several batches, several raw material suppliers, the full range of values, including the ones seen only in an incident. What the question of sample numbers really covers.
- Rigorous pairing between the spectrum and the reference sample, same material, same instant, same place. The first success factor of a calibration, and the gap hides in the dispersion, where it reads as an instrument effect.
- A formalised domain of validity. Outside its domain a model calibrated on samples carries on returning a value with the same assurance. That is why a sound model comes with out-of-domain detection: Hotelling’s T², Mahalanobis distance, unmodelled residuals. Both texts expect them, and in these words. ICH Q14 names them among its diagnostics — “Outlier diagnostics […] (e.g., Hotelling’s T-squared or Mahalanobis distance)”, “Examination of residuals […] (e.g., x-residuals or F-probability)”. And the FDA guidance of August 2021 on NIR procedures places them under specificity, at § V.B: “Another element of specificity is the ability of the method to reject outliers (e.g., samples with high leverages or high residuals).”
- A model maintenance plan: residual monitoring, recalibration criteria, change management. A model is a living work rather than a deliverable.
The entry price of NIR is paid elsewhere than at the purchase of the instrument. It is paid in reference samples, in line time on representative batches, and in upkeep of the model over its whole life. A justifiable outlay, on condition that it is announced at scoping rather than discovered in the sixth month.
One useful exception. Where the criterion is a stabilisation, blend until the dispersion stops falling, a calibrated model becomes unnecessary. That is the subject of the page on detecting the endpoint.
The ways to install it
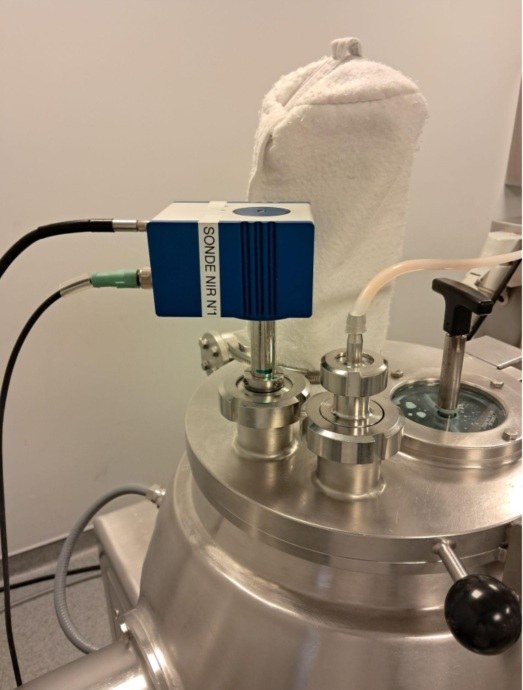
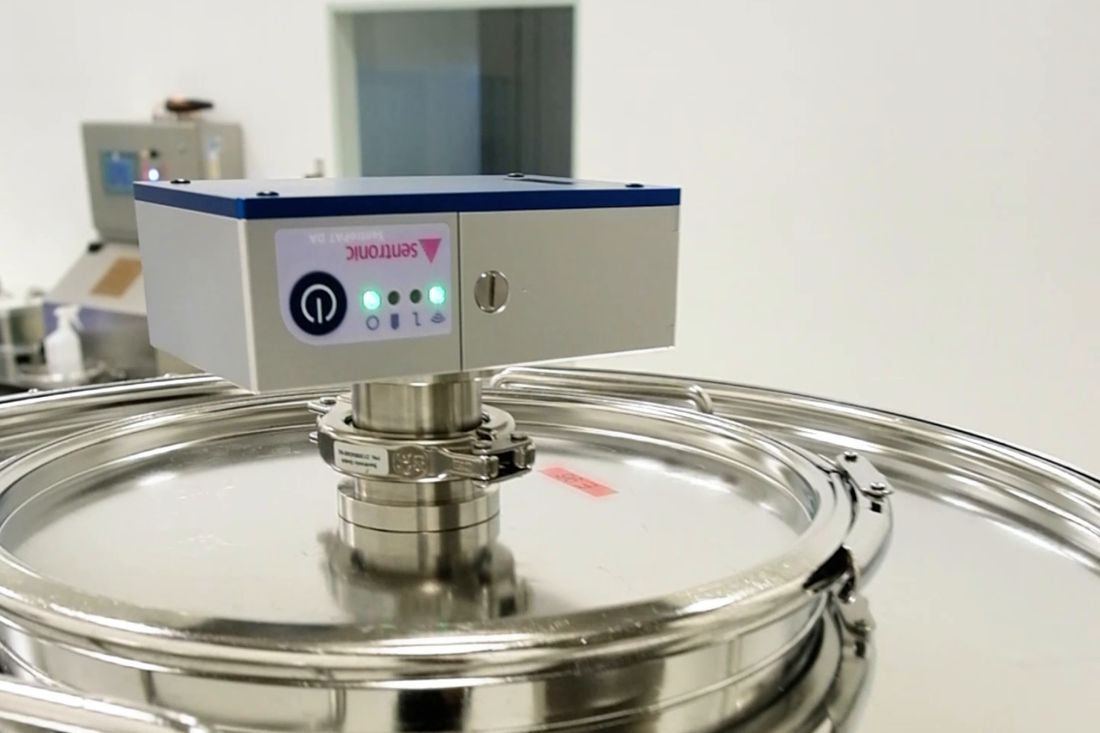
The optical fibre carries the electronics away from the product: that is what allows the optics to sit where the product passes, and one instrument to serve several parameters.
| Configuration | What it allows | What it calls for |
|---|---|---|
| Probe in contact or immersed | Measurement in the mixer, the dryer, the pipe. The reference position for steering an operation. | A nozzle, a probe penetration, and cleaning of the optical window. |
| Window in the wall | The optics stay outside, only the window is in contact with the product. Cleaning and qualification are simplified. | A penetration on qualified equipment brings a requalification, to be costed at scoping. |
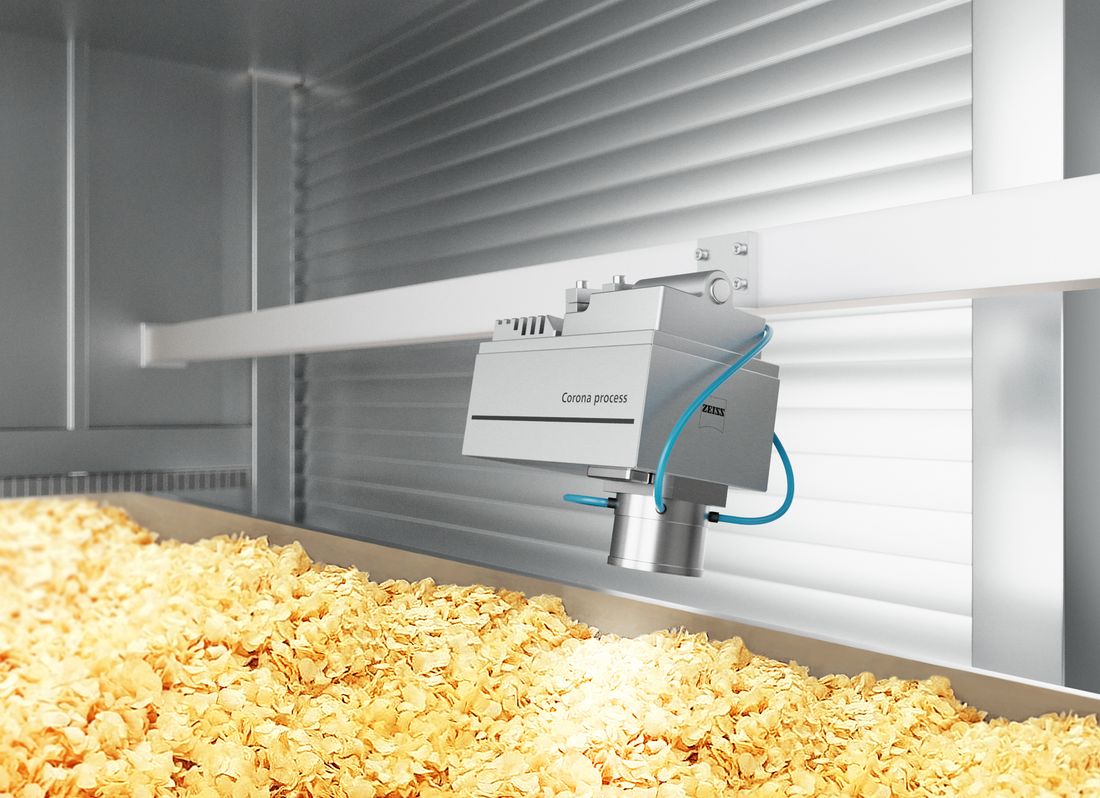
| Contact-free above a flow | Measurement on a belt, a chute, a transfer section, with no part in contact. | No fixed distance to hold in agri-food: on the ZEISS instruments we deploy there, a laser sensor measures the distance in real time and corrects the signal automatically. |
| Multi-point configurations | Several measurement spots per acquisition, or several channels on one analyser: the engineering answer to representativeness. | Thought given to where the points sit, since points poorly placed multiply the same error. |
| ATEX and GMP adapted heads | Deployment in explosive atmospheres and pharmaceutical areas, with compatible materials and surface finishes. | The compliance file for the installation, which belongs to the operator as much as to the equipment. |
Transmission places source and detector on either side of the product. It crosses the whole thickness rather than probing the surface, which suits a single tablet. In exchange it calls for a constant geometry, and the admissible thickness becomes governing.
Three properties of the measurement, settled by design
They are handled by the design of the arrangement, and the arrangement is where the gain sits.
One acquisition probes a few milligrams
The analysed mass is the area of the measurement spot multiplied by the probed depth and by the bulk density. For a spot radius of 2.5 mm, a powder at 0.38 g/cm³ and an assumed depth of one millimetre, the calculation gives about 7.5 mg, and 30 mg for a 10 mm spot. Set that against the tens or hundreds of kilograms in the vessel. Repeating the measurement in the same place reduces the instrument noise. Representativeness comes from measuring several portions. What the sensor really analyses, and what that implies for your sampling strategy.
A variant of the same measurement lifts part of that limit: in hyperspectral imaging, each pixel carries a full NIR spectrum. A field is probed rather than a point, and a distribution map is what comes out. The counterpart is twofold. The surface is what is seen, and a pixel receives a fraction of the flux of a point probe, so the spectrum is far noisier.
Penetration depth is a property of your material
There is no fixed value for the penetration of scattered light into a powder. It follows the hardness, the particle size, the bulk density, the composition and the wavelength. It can also change during one process, as the product densifies, agglomerates or dries. The millimetre in the calculation above is a working assumption rather than a specification. The mass really probed is therefore itself a variable of the process you are following, and the arrangement rather than the signal-to-noise ratio is what governs it.
Broad bands, and a strong response to the physical state
Overtones and combination bands are wide and overlap. Two close molecules, two grades of one excipient, sometimes two polymorphs give nearly superposable spectra. RAMAN and MIR discriminate more finely there. Symmetrically, a change in compaction or in particle size shifts the baseline as much as a change in concentration. An asset where a physical property is what you want to follow, and a point to control where a content is the target. The model learns the physics while it is asked to learn the chemistry, and it moves as soon as the material changes appearance.
The mechanism is optical before it is chemical. The larger the particles, the further the light travels inside the material before it comes back out to the detector, and the higher the apparent absorbance climbs — at rigorously identical composition. A less porous, more compacted bed produces the same drift. The spectrum therefore records the physical state of the bed alongside its composition, and nothing in the signal says which of the two moved.
Frequently asked questions
Can a calibrated model be bought with the instrument?
Yes, in two cases. For raw material identification with a handheld spectrometer, the spectral library comes with the instrument and is then verified on your own lots. In agriculture and food, ready-calibrated models are available on request, in the field, in the laboratory and in the process. Outside those cases, a content model follows your matrix, your reference method and your variability: it is built, one parameter at a time.
Will the model survive a change of raw material supplier?
That is the test that counts. Good practice: bring several sources into the calibration where they exist, then watch the residuals in production to detect entry into unknown territory. Transferring a model to a second instrument calls for the same vigilance: a standardisation, and sometimes a partial recalibration.
Is NIR recognised by the pharmacopoeias?
It is, and the answer differs on either side of the Atlantic. The European Pharmacopoeia gives it a general chapter, 2.2.40 Near-infrared spectroscopy, which is enforceable as soon as a monograph calls it. The USP treats NIR on two levels: the former ‹1119› became ‹1856›, numbered above one thousand, so guidance; and since 1 November 2020 ‹856›, numbered below one thousand, carries the requirements — instrument qualification, procedure, validation and verification.
NIR and RAMAN therefore stand on equal footing. Both techniques have exactly the same two-level structure at the USP, from the same modernisation of the spectroscopy chapters: ‹856› and ‹1856› for NIR, ‹858› and ‹1858› for RAMAN — the former ‹1120› having been replaced on 1 August 2020, as the former ‹1119› was for NIR. On a US filing an NIR method leans on an enforceable chapter just as a Raman method does.
A third text applies, specific to NIR: the EMA devotes a dedicated guideline to it, the Guideline on the use of near infrared spectroscopy by the pharmaceutical industry and the data requirements for new submissions and variations (EMEA/CHMP/CVMP/QWP/17760/2009 Rev. 2, dated 27 January 2014). Its executive summary calls NIR “one of the major techniques in Process Analytical Technology”. Above all it introduces the notion of the scope of the NIRS procedure: a change within the approved scope is subject to GMP only, a change outside it calls for a variation. It is the text to open before writing the NIR part of a European dossier.
What remains true, and does not depend on the chapter number: ‹856› sets requirements, it does not validate your method for you. Instrument qualification, procedure, validation and verification stay with you, and that is prepared during method development, not at submission.
Is the instrument compliant with 21 CFR Part 11?
Compliance is demonstrated on the whole system. The declarations of conformity state it themselves: overall compliance rests on the operator’s procedural controls. Account management, audit trail review, method locking, validation plan. The difference between "21 CFR Part 11 ready" and a validated system.
What sets the time before a usable model?
Knowing whether the signal exists and separates is quick. A robust model needs to have seen the real variability of production, which sometimes means waiting for a demanding batch or a season. A feasibility concluded on a single batch tells you nothing about routine.
And where another route serves better?
It happens, and it is worth establishing early. Four situations sit outside the domain of NIR.
- A constituent at very low content.
- A matrix free of hydrogen bonds.
- Two compounds spectrally alike.
- A need for spatial distribution inside an opaque volume.
Each of the four has an answer. RAMAN, MIR and electrical tomography each take up part of these cases, and the scoping says which. The conditions a non-destructive measurement holds on.
The instruments we implement
Sentronic, NIR spectrometers
Immersed probes, diffuse reflection, transmission, multi-point configurations and optical heads adapted to ATEX and GMP environments.
ZEISS, NIR for food and agriculture
Measurement modules designed for natural matrices and food production environments.
In both cases, the calibration for each constituent remains to be built. These instruments bring long-term instrumental stability, internal references, documented qualification, transferability. That leaves the modelling, which is the part of the project we take on, and the part whose cost belongs before the order.
Describe your matrix and the parameter you are after. You will hear whether NIR holds.
Forty-five minutes is enough: whether the signal exists on your product, which installation configuration is realistic on your equipment, and what the model would represent in samples and in line time.