
“Which molecule is this? Is this grade really the one announced? Has my reaction reached its end?” Three questions that call for an answer in seconds, often without opening the container.
The laboratory identity check remains the reference; what changes is when the answer arrives.
Where you meet it: sorting polymers, black ones included; identity at weighing in cosmetics; crystal form of an active ingredient.
The essentials in four points
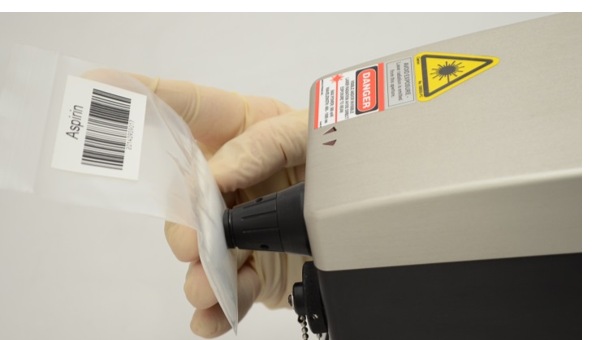
- Identifies the molecule through a vial, a bag or a transparent wall, container closed.
- Reads polymorphism: polymorphs, hydrates, amorphisation.
- Answers symmetric, weakly polar bonds (C–C, S–S, aromatic rings). Water goes unnoticed here, which opens the measurement in aqueous media.
- Reference texts: in pharma, Ph. Eur. 2.2.48 and USP ‹858›; outside pharma, ASTM D6122 and E1840.
How the measurement works
A monochromatic laser lights the sample. Fewer than one photon in a million leaves shifted: the molecule has taken a little energy from it by vibrating, and that gap is the signature of the bonds present. That ratio explains the integration time and the difficulty of low concentrations.
The spectrum is a map of bonds, not of atoms: two powders of identical elemental composition and different structure do not look alike.
Where the instrument sits
Typical applications
Raw material identity
Checking on receipt, sorting plastics, verifying a grade before transformation.
Reaction monitoring
The band of a reactant falls, that of a product rises: stopping becomes chemical, not hourly.
Composition of a liquid
Dissolution followed with no sampling; low contents where the signature is marked.
Polymorphism
Polymorphs, hydrates, amorphisation: the form obtained, and when it switches.
RAMAN and infrared: the rule that separates them
RAMAN and infrared probe the same vibrations under different selection rules: the strong bands of one are often quiet in the other. They complete each other, and water often decides between them — strongly absorbing in infrared, it goes unnoticed in RAMAN. That opens measurement in aqueous media, on reaction monitoring, crystallisations and dissolutions.
That complementarity has a physical reason, and it states simply. Infrared answers vibrations that change the dipole moment: polar bonds, O–H, C=O, N–H. RAMAN answers those that change the polarisability: symmetric, weakly polar bonds — C–C, S–S, N–N, the carbon backbone, disulfide bridges, aromatic rings. It is the same rule that makes one see water and the other look straight through it. The choice between them is therefore made on the bond you need to follow. The infrared condition is stated as such by USP: “Mid-IR represents the spectrum of absorption of chemical bonds where a difference in the dipole moment exists (O–H, N–H, C=O, C–H)” — Control strategy for continuous manufacturing of drug substances, © 2025, § 2.4.5.
Identity card of the technique
| Criterion | RAMAN |
|---|---|
| What the measurement sees | Inelastic scattering, fewer than one photon in a million. Symmetric, weakly polar bonds: C–C, S–S, N–N, the carbon backbone, aromatic rings. |
| Selectivity | Very high. Fundamental vibrations and sharp peaks, as in mid-infrared: distinctive peaks are often enough to identify. |
| What interferes | Matrix fluorescence, before anything else — and raising the power amplifies it too. Water does not get in the way. Less sensitive than NIR to particle size and packing, without being indifferent to them. |
| Sample presentation | No preparation, through a transparent or translucent container, by focusing the laser. Effective in solution. |
| What the model requires | Nothing to identify: a library and a threshold. A chemometric model only for quantitation. |
| Reference texts | In pharma: European Pharmacopoeia 2.2.48. At the USP, the enforceable chapter ‹858›, paired with an informational ‹1858›. Outside pharma: ASTM D6122, extended to Raman, to validate an on-line analyser; ASTM E1840 for the Raman shift standards that check the spectral axis. |
Creaming followed with no sampling
Water, and why it decides so often
Water is a poor RAMAN scatterer. That is the exact inverse of infrared, where water absorbs massively and covers the rest. The direct consequence: measurement in an aqueous medium is open in RAMAN, where it asks for careful design in MIR.
So RAMAN appears on reaction monitoring in solution, on crystallisations and on dissolutions. The choice between technologies turns on that kind of physical detail.
On quantitative needs, the model follows the usual rules
Decomposition onto pure-component spectra, or regression on reference values. The choice arises early and it structures the whole project. What calibration burden your measurement carries.
What the portable instruments contain
Identity-check devices rest on a fairly homogeneous set of characteristics, worth knowing before comparing offers.
| Characteristic | What is announced | Why it matters |
|---|---|---|
| Excitation wavelength | 785 nm | The trade-off between signal intensity and fluorescence of the matrix |
| Laser | Frequency stabilised, line width under 0.15 nm | A line that drifts shifts the spectrum and skews the comparison with a reference |
| Estimated laser lifetime | Over 10,000 hours | A cost-of-ownership item, to be built into the maintenance plan |
| Spectrograph | Optimised for the NIR, 250 to 2350 cm⁻¹ | Covers the skeletal bands and the functional groups |
| Measurement mode | In contact | Calls for physical access and a cross-contamination arrangement |
| Laser class | IIIb | Personal safety: instructions, training, eye protection |
The domain of the technique, and the domain of the spectrograph
The table above gives the domain of the instrument: 250 to 2350 cm⁻¹. The domain of the technique is wider, and USP gives it in its technical guide on drug substances in continuous manufacturing: RAMAN is useful on crystalline compounds and polymorphs because the spectra show sharp, distinct and well-resolved bands between 50 and 4000 cm⁻¹.
The gap between the two is not a defect, it is a design choice, and it is checked before the order. Where the need is polymorphism, the lower bound of the spectrograph is the first question to put to the supplier, before resolution: it is what says how far down the instrument reaches into the range USP describes.
The same text confirms two things this page states elsewhere. Water gives a very weak RAMAN signal, which makes complicated mixtures directly analysable with little interference from sample moisture. And RAMAN is useful on-line for heterogeneous reaction monitoring, particle size detection and polymorph monitoring — with a reservation USP writes itself and which is worth having read: some of those attributes are not directly measured by RAMAN, the technique playing a valuable role in the measurement process without being the whole of the measurement. That is exactly the distinction the calibration burden makes visible.
USP Technical Guide, Control strategy for continuous manufacturing of drug substances, © 2025 The United States Pharmacopeial Convention, Rockville, MD — § 2.4.2. An informational document: it carries no requirement.
Three points to settle before committing
Neither secret nor prohibitive. Simply rarely brought forward, while they are what decides whether a deployment holds in routine.
Dark materials call for the reduced-power mode
A dark material absorbs the excitation light rather than scattering it. The surface heats, and can melt or burn and leave residue on the optics. So the arrangement matters as much as the sample.
The answer is a physical power switch rather than a software setting: reduced mode lowers the power the sample receives. The instruction itself admits no exception: never high power on a black plastic. The exact powers are on the datasheet of the instrument you select: the PolyLab B1 sheet from Enwave Optronics announces a 785 nm laser at 300 mW. That is a figure at the laser output — what actually reaches the sample is lower, the optics taking a share, and that is the one to ask for.
Worth stating as it is: three levers, the excitation wavelength, the reduced-power mode, and shielding from ambient light. Any promise beyond those three deserves documenting before it is relied on.
Ambient light is part of the method
Even small amounts of ambient light finding their way into the analysis zone disturb the identification, and fluorescent tube light is the demanding case. That is precisely the lighting of many goods-in areas.
So the shielding covers and dedicated sample holders belong to the method rather than to the accessory list, and the procedure makes their use mandatory. A result obtained with the cover open is a different result from one obtained closed, and the screen alone reads the same.
The library sets the reach, and that is where we work
Materials are identified once they are in the library. An instrument matches a polymer to the closest of those it knows, so the library is what carries the capability.
The libraries supplied cover a few dozen common families. Engineering polymers in everyday use are added, sometimes by acquiring the reference spectrum on a bench instrument before carrying it into the handheld. And two neighbouring fluoropolymers can stay very close to each other.
That makes it a service point rather than a product point. Extending beyond the common families goes through building a library, with samples of yours. It is planned inside a proof of concept.
Two points worth reading closely
A correlation percentage becomes a criterion once you set the threshold
The index returned on screen is a correlation percentage with a colour code. It ranks a resemblance, and the decision is yours to define. Manufacturers publish no numerical rejection threshold, and the useful move is to establish one rather than assume it.
A threshold is built, at your site, on true negatives: materials close to the target but different, run under real conditions, watched for how high they climb. That work is what turns a display into a criterion that stands up. See raw material identity.
The 21 CFR references quoted are laser-safety standards
Some product sheets quote references in 21 CFR, 1040.10 and 1040.11. These are laser safety standards: Laser products and Specific purpose laser products, two sections of part 1040, Performance Standards for Light-Emitting Products, subchapter J — Radiological Health. 21 CFR Part 11 is titled Electronic Records; Electronic Signatures. Setting the two titles side by side settles it. Data integrity, electronic records and signatures are covered elsewhere.
An audit would pick the distinction up, so it is worth making first. The gap between an instrument announced as compatible and a validated system is handled separately.
A quality behaviour worth requiring
Some instruments impose a performance verification on a polystyrene standard at every power-up. The device measures the standard’s spectrum, compares it with the one in its library and requires a minimum match index. All identification functions stay disabled until the test passes. Alongside it sits a three-level rights arrangement: administrator, supervisor, operator.
That is the behaviour you want on a device that pronounces conformity decisions. The verification is mandatory, and the device holds off working until it passes. Put the question to any supplier. The answer separates them.
Where another route serves better
A fluorescent matrix sits the useful signal on a strong background. Fluorescence is several orders of magnitude more intense than RAMAN scattering, and raising the power raises it too. USP names a concrete case: its technical guide on control strategy for drug substances in continuous manufacturing cites microcrystalline cellulose among the substances whose fluorescence background makes a high-quality RAMAN spectrum hard to obtain. It is an excipient found in many solid oral forms, and a good reason to run the trial on your matrix before choosing the instrument. The same guide lists the four levers then on the table: excitation wavelength, sample preparation, instrument configuration and data analysis. On your product, which of the four is in play? USP Technical Guide, Control strategy for continuous manufacturing of drug substances, © 2025 The United States Pharmacopeial Convention, Rockville, MD — § 2.4.2. A product heterogeneous at the scale of the spot brings in the mass really analysed: the point measured describes that point. And for moisture content on a powder, NIR spectroscopy stays more direct.
Each of these is recognised during a trial rather than after an installation. The conditions a non-destructive measurement holds on.
The instruments we implement
Enwave Optronics, RAMAN spectrometers. Portable, bench and process systems, with immersed probes and contact-free heads. Several excitation wavelengths, to arbitrate between signal intensity and fluorescence of the matrix.
One piece of information we prefer to give at the outset: alignment with data integrity requirements is under way at this manufacturer. In a regulated environment that belongs in the project schedule, established at scoping rather than at qualification.
Frequently asked questions
Can a black plastic be identified by RAMAN?
Yes, using the reduced-power mode. A dark material absorbs the excitation rather than scattering it: at full power the surface heats, melts or burns and fouls the optics. The reduced mode lowers the power at the sample, through a physical switch rather than a software setting. The manufacturers’ rule: never high power on a black plastic.
What makes identification possible despite the absorption is therefore not the laser but the collection train: a wide-aperture spectrograph, deep Rayleigh rejection, a cooled detector. The signal from a black plastic is weak, not absent — and few instruments are built to go and find it.
Is RAMAN recognised by the pharmacopoeias?
It is, and on this particular point RAMAN and NIR stand level. The European Pharmacopoeia gives it general chapter 2.2.48 Raman spectroscopy. The USP does the same: ‹858› Raman Spectroscopy is numbered below one thousand, so enforceable, and it is paired with an informational ‹1858›. A monograph can call ‹858› as a test method.
Near infrared follows exactly the same construction since 1 November 2020: ‹856› carries the requirements, ‹1856› explains them. Both techniques therefore stand on the same footing, at the USP as in the European Pharmacopoeia. What separates them is the physics and the calibration burden, not the pharmacopoeial status.
Is a calibrated model needed for identification?
Not in the sense of a regression. Identification compares a spectrum with references and returns a resemblance. The library, though, is built and maintained, and the decision threshold is established on your materials.
RAMAN or infrared: which to choose?
The strong bands of one are often weak in the other. Two criteria usually settle it. The presence of water, demanding in infrared and well tolerated in RAMAN, and the fluorescence of the matrix, which weighs on RAMAN and leaves infrared indifferent. Often the sound answer is to test both on a few samples.
Can it measure through a vial or a bag?
Often yes, and it is a real asset for checking on receipt: the container stays closed, so the contamination risk stays closed with it. It depends on the container, which brings its own signature to the spectrum. This configuration is validated on the containers you actually use rather than on a demonstration container.
What to do where the material is outside the library?
It is added, from reference samples whose identity is established by an independent method. Depending on the material, the reference spectrum may be acquired on a bench instrument and then carried into the handheld. That is foreseeable, it is planned, and it is generally the bulk of the work in an identification project.
Does the laser carry a risk for operators?
These devices carry a laser class that brings instructions with it: no direct viewing, user training, eye protection according to the configuration. It is a personal safety subject, separate from the data management requirements.
Send us three demanding materials. You will hear whether RAMAN separates them.
Forty-five minutes is enough: placing the need, saying whether the fluorescence or the colour of your materials calls for care, and estimating the library-building effort.