
“How much coating have I actually laid down? Is the spread between tablets under control? Can I stop the cycle at the right moment?” Three questions that arise, and are settled, during coating.
Optical coherence tomography, or OCT, answers them inside the drum: a cross-sectional image of the coating, at the micron scale, on a tablet still turning. The microscope cross-section remains the reference.
Where you meet it: tablet coating, functional coatings, surface roughness.
The essentials in four points
- Returns a cross-section of the material without cutting it: the coating thickness is read off the section, in microns.
- A direct geometric measurement: an optical path, converted into thickness by the refractive index of the coating. No chemometric model.
- Contact-free and mark-free, at a fixed working distance: that is the main installation constraint.
- Reference texts: in pharma, Ph. Eur. 5.24 names OCT; for roughness, ISO 21920-2 and 21920-3.
How the measurement works
White-light interferometry: every interface inside the material sends back an echo, placed at its exact depth. Moving the beam sideways stacks these profiles into a cross-sectional image, like an ultrasound scan made with light.
Where the instrument sits
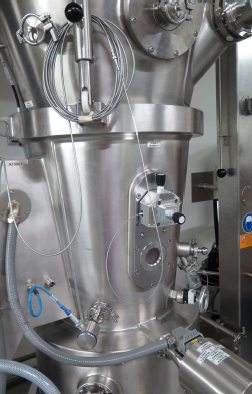
Typical applications
Coating thickness
Coating thickness and its spread between tablets, during the cycle.
Internal structure
Stacked layers, interfaces, defects below the surface, read off the section.
Stopping on thickness
Following coating growth and stopping the cycle on a thickness reached.
A real case
A coating driven by weight gain, then by thickness measured in the drum.
Three points ask for care, addressed further down: the working distance, pigmented coatings and the quoted throughputs.
Identity card of the technique
| Criterion | OCT tomography |
|---|---|
| What the measurement sees | A cross-section of the material without cutting it, by low-coherence interferometry. Coating thickness and roughness, tablet by tablet. |
| Selectivity | Not applicable: the quantity is geometric. Two coating formulations of equal thickness are indistinguishable. |
| What interferes | Titanium dioxide and iron oxides scatter the light to the point where the coating-core interface becomes undetectable. And the distance between head and tablet makes the depth scale drift. |
| Sample presentation | Contactless, in the coating drum, on moving tablets. The first 100 to 200 microns below the surface. |
| What the model requires | Nothing for the thickness of an unpigmented coating: the quantity comes out of the measurement geometry. A model and references for internal morphology, or for the workaround on a pigmented coating. |
| Reference texts | In pharma: no chapter is devoted to it in its own right; Ph. Eur. 5.24 names OCT among the three-dimensional imaging methods. Outside pharma: ISO 21920-2 and ISO 21920-3 for roughness; for a thickness, the method is validated against your laboratory’s reference method. |
A direct geometric measurement, and what it changes
It is a direct geometric measurement. The instrument returns an optical path, converted into a physical thickness by the refractive index of the coating. There is no chemometric model to build, to validate or to maintain. No design of experiments, no reference sample campaign, no revalidation at each excipient batch change, no model drift to watch.
That is the central difference from spectroscopic approaches, which answer with a quantity correlated to thickness. Why some measurements call for a model and others do not.
The entry cost exists, and it has moved: it sits in the installation geometry rather than in the calibration.
The interferometric principle, in detail
The material is lit with broadband, therefore weakly coherent, light. The beam is split in two: one part goes to the sample, the other to a reference mirror. The light returning from the sample has been sent back by every interface it met, the coating surface, the coating-core interface, the internal heterogeneities. Those echoes interfere with the reference path only where the two optical paths are of similar length, to within the coherence length. What comes out at one point is a depth profile.
What the instrument really returns
| Quantity | Where it comes from in the image | What it covers |
|---|---|---|
| Coating thickness, tablet by tablet | Distance between the surface echo and the coating-core interface echo | A geometry: two formulations of equal thickness read alike |
| Dispersion of that thickness | Statistics over thousands of tablets measured during the cycle | The population seen, and uniformity within one tablet beyond the zones viewed is a separate question |
| Surface roughness | Local variations of the surface echo | The surface, with adhesion and coating stress belonging elsewhere |
| Internal morphology descriptors | Image structure over the 100 to 200 µm below the surface | Descriptors, to be interpreted in a given context rather than as a standardised quantity |
The second row is the one a coating process cares about. Measuring thousands of tablets during the cycle gives the dispersion of the thickness, not its mean alone: tablet-to-tablet uniformity, measured while it builds. An end-of-cycle criterion bearing on uniformity rather than on the quantity sprayed.
What the software shows during the cycle
Two image treatments coexist according to whether the coating is transparent or pigmented. The choice between them follows the composition of the coating.
What a roughness figure assumes
A roughness value does not exist on its own. It is defined by a sampling length, an evaluation length and a cutoff filter, and that triplet is what fixes the value read, whether it is called Ra, Rq or Rz. The framework is ISO 21920-2 for the parameters and ISO 21920-3 for the specification operators; these two replaced the withdrawn ISO 4287 and ISO 4288 on 20 December 2021, though the older numbers are still widely quoted.
Two practical consequences. One profile yields two numbers depending on the filter applied: removing the waviness lowers the value. And two instruments that do not state their convention do not compare, even when they display the same symbol.
So the question comes before the figure: under which convention, over what length, with which filter? A roughness quoted without those three elements is not wrong — it is simply not comparable, either with another measurement or with a specification.
Parameter definitions and filter selection: Carl Zeiss surface metrology chart, 2011, after ISO 4287, ISO 4288 and ISO 3274. ISO 4287 and ISO 4288 were withdrawn on 20 December 2021 and replaced by the ISO 21920 series: a roughness figure quoted today is worth stating together with the edition it was computed under.
The engineering factor that decides projects
The distance between the measurement head and the tablet decides, ahead of the resolution, the throughput or the software. It deserves to be raised in the first technical discussion.
The depth scale of an interferometric measurement drifts with that distance. The two published figures do not measure the same thing, and that is what makes the constraint readable. One pixel of offset introduces about 0.19 µm of error on the thickness; and twenty pixels of offset correspond to about 40 µm of distance variation, which is what bounds the usable tolerance. The mechanical eccentricity of a coating pan runs to hundreds of microns.
So the gap is an order of magnitude, and it is handled: rigid positioning of the head, design of the mount, distance tracking and correction. But at the installation study, rather than at commissioning. A project that orders the instrument before measuring the eccentricity of its pan meets the subject at the worst moment.
It is the best question to put in a meeting, to a supplier as much as to us: what working-distance tolerance, and how do you hold it on a real pan?
What is demonstrated, and under which conditions
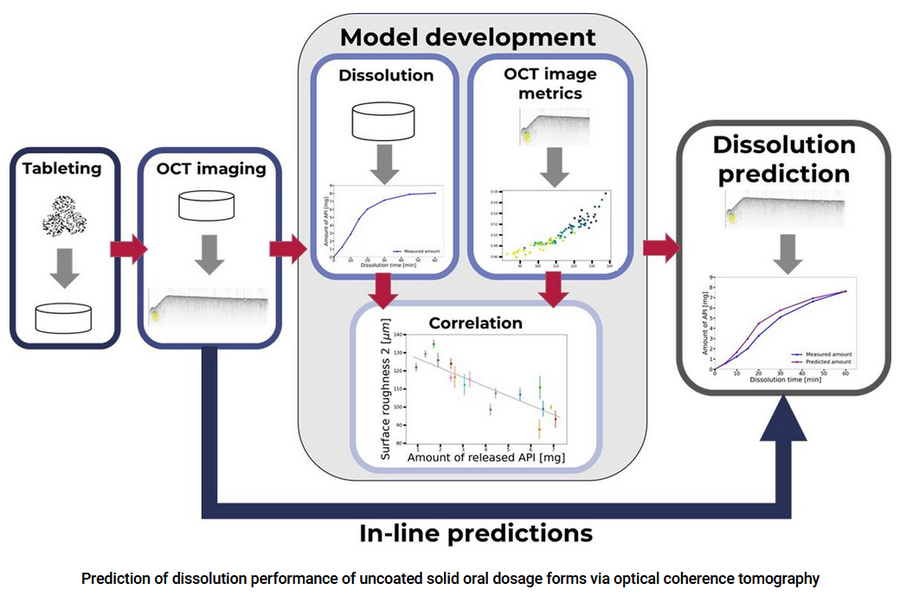
Three published results make up most of the file. They carry different weight, and their conditions of validity belong with them, since that is what makes the demonstration defensible in front of an assessor.
A measurement trajectory that guarantees a dissolution profile
One study establishes it. A dissolution profile stays conforming as long as the measured trajectory, thickness and roughness, remains inside its control limits, including where the process is deliberately disturbed. It is co-signed by three authors from the American medicines authority. It is the strongest piece in the file: it links an in-line measurement to a control chart and to a quality attribute.
It establishes that link for a given product, in a given domain. Carrying it to your formulation means running the demonstration again and writing it into your control strategy. That is a analytical procedure validation project in its own right, with a marked path and an ambitious objective.
A dissolution prediction on uncoated tablets
A second study predicts dissolution performance from internal morphology and roughness descriptors, with a machine-learning model. The conditions count as much as the result.
- It covers uncoated tablets, so it is a different thing from a thickness-dissolution correlation.
- The model is specific to the product, and extrapolation outside the learning domain calls for care.
- It is an at-line proof of concept, with at least 35 images averaged per tablet. In-line there is at best one image per tablet, and the authors write it explicitly.
- What comes out of it is therefore a statistical batch marker rather than a unit release.
Titanium dioxide and iron oxides scatter the light
This is the physical bound of the method: these pigments scatter the light to the point where the coating-core interface stops returning a usable echo. A route around it exists and it is serious. A scattering descriptor called zone height, obtained by unsupervised classification over nearly 24,000 images. Relative standard deviation of 2.6 %, and sensitivity from 20 minutes of process.
And it was established on one formulation, at a titanium dioxide level of about 32 %, with the pigment threshold and the coefficient of determination still to be published. Above all the measurement there becomes indirect and referenced, so it sets aside exactly what gives it its value elsewhere, being direct. On a heavily pigmented coating the feasibility is therefore established first, and the project built on it.
The quoted throughputs count different things
This is the least stable point in the whole file. The available documents give very different figures because they count different things. Image acquisition rate, rate of usable measurements, number of tablets actually characterised per hour. The only figure we use is the last. It comes from the most complete published study: of the order of 500 tablets an hour really measured, in the configuration of that study. Any other throughput quoted outside its measurement context carries no decision value. And the useful question stays: how many tablets an hour, in my pan, with what use behind it?
What is worth preparing on your side
- The composition of the coating and its pigment level. First criterion of applicability, ahead of any other consideration.
- The refractive index of the coating, or the means to establish it. It is what converts the optical path into a physical thickness.
- The geometry of the pan: diameter, speed, optical access, and an eccentricity measurement taken before the project. It is worth several meetings.
- Reference tablets whose thickness has been established by section and microscopy. They serve to verify rather than to calibrate, and the distinction changes the effort involved.
- Deliberately disturbed batches, where the material and the regulations allow. That is what establishes that the measurement sees a drift rather than a nominal trajectory alone.
- A decision on what the measurement is to drive: cycle stop, trajectory monitoring or an element of the file. The three call for different integration effort.
Where another route serves better
Composition belongs to a spectroscopic measurement
A thickness is a geometry rather than a content. Where the question bears on what is in the coating, a spectroscopic measurement answers it. NIR spectroscopy, for instance, with the model calibrated on samples that comes with it.
Through a pack: NIR and RAMAN on the transparent, TERAHERTZ on the opaque
Many packs let the light through: a polyethylene bag, a translucent film, a glass vial. NIR and RAMAN work well there, RAMAN passing through glass without difficulty. Where the pack is opaque, pigmented or metallised, TERAHERTZ takes over, and its argument against X-rays is deployability rather than detection performance.
It sees what it lights, so numbers carry the statistics
Each image covers a small zone of one tablet. The statistical value comes from the number of tablets seen rather than from the fineness of one image. It is a sampling question, and it is reasoned as one.
Frequently asked questions
How deep does the measurement go?
On a tablet, the documented use covers the first 100 to 200 microns below the surface, which amply covers a coating. Beyond that the light is scattered too much for the signal to stay interpretable. So the useful depth follows the material: a clear coating lets you see further than a heavily pigmented one.
Is a model needed, yes or no?
For the thickness of an unpigmented coating: no, the quantity comes out of the geometry of the measurement. For the internal morphology descriptors, or for the route around a pigmented coating: yes. A model and references come in, to build and to keep alive. It is the most important nuance on this page.
Does the movement of the tablets blur the image?
The acquisition time is very short against the speed of a tablet in a drum, which settles the blur. The real question is movement in distance rather than movement in the plane. A tablet passing nearer or further than the working window shifts the depth scale. Back to the engineering factor described above.
How is the measurement verified as accurate?
By comparison with an independent method: section and microscopic observation on dedicated tablets. It is a verification rather than a calibration. No model is built on those values, a deviation is checked. Then a periodic check on a standard and a follow-up of the working distance. A drift here is mechanical or optical before it is numerical.
Can it be used to release a batch?
Not as it stands. What the literature supports today is trajectory monitoring linked to a control chart, and a statistical batch marker. A unit release would mean characterising every tablet, which the real throughputs place further ahead.
Do we find out quickly whether it works on our product?
Knowing whether the coating-core interface is detectable on your formulation is quick, and that is the question that settles it. A robust criterion then needs representative batches. A proof of concept concluded on a single batch tells you nothing about routine. A documented conclusion either way stays a useful deliverable.
The instruments we implement
Phyllon, OCT tomography. Laboratory configurations and measurement heads integrable in-line, for coating control in production.
Send us the composition of your coating and the characteristics of your pan. That is where it starts.
Forty-five minutes is enough: whether the coating-core interface is detectable on your product, what the installation would call for on your equipment, and what useful throughput you can expect from it. Where the coating is heavily pigmented or the pan strongly eccentric, we will say so — and where to look instead.