
A spectroscopic measurement does not analyse your batch. It analyses a few milligrams, a few tens at best. Everything about content uniformity follows from what you do with that sentence.
In short
NIR follows the content, or the convergence of homogeneity during blending. A content value requires a full model; a convergence criterion does not, but the procedure is validated. It probes only a few milligrams to a few tens: it is their repetition, turn after turn, that builds the criterion.
Depending on your sector: incorporating an additive or premix into animal feed; homogeneity of a powder or base in cosmetics; blending before compression in pharma, where dose uniformity comes on top.
Which texts apply depends on your sector
This page uses pharmaceutical vocabulary, because that is where the requirement is most formalised. Everything about the homogeneity of a blend — the endpoint criterion, the sampling, the mass actually probed — transfers unchanged to every sector. Everything about dose uniformity assumes a dosage unit, and does not transfer.
- Pharma and drug substance — the test is USP <905> and Ph. Eur. 2.9.40, with 2.9.47 as its large-sample alternative; the spectroscopic blend endpoint, the FDA NIR guidance of August 2021.
- Food and animal feed — there is no dosage unit: what is controlled is the homogeneity of the blend itself. Applying near infrared falls under ISO 12099, official control under Regulation (EC) No 152/2009.
- Cosmetics — no dosage unit either, so no dose uniformity test. The frame is Regulation (EC) No 1223/2009 and ISO 22716.
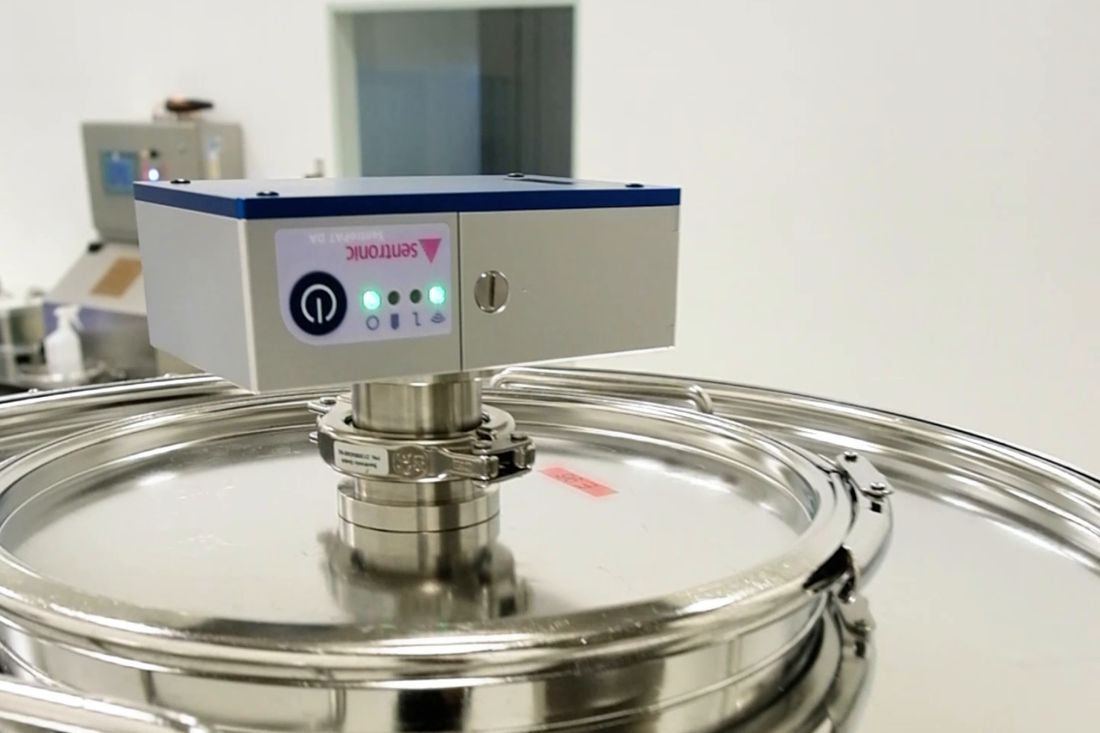
The order of magnitude is a calculation: probed mass = pi times r squared, times bulk density, times explored depth. For a spot 10 mm across, a powder at 0.38 g/cm³ and a depth of one millimetre, that gives about 30 mg. The figure comes out of arithmetic. The calculation carries assumptions, two of which move during a process, and the order of magnitude holds.
Set that beside usual practice. Ten one-gram increments taken with a thief from a three hundred kilogram batch, three thousandths of a per cent of it, with a tool that disturbs the powder bed at the moment it samples it.
The limiting factor in content uniformity has never been the performance of the instrument. It is the sampling strategy.
What is actually measured
A content at one point is an increment
That is the exact term from sampling theory: an elementary increment, whose value means something once aggregated with others. Repeating it in the same place reduces instrument noise, and measuring several portions is what speaks for the batch.
Homogeneity is a scale rather than a state
A blend can be homogeneous at the kilogram scale and heterogeneous at the tablet scale. The question is therefore whether it is homogeneous at the scale of the dose, and that scale sets the mass to probe.
Blend homogeneity and dose uniformity are two quantities
One bears on the powder in the vessel, the other on the final dosage unit. On that second one, the European Pharmacopoeia separates uniformity of content of single-dose preparations, test 2.9.6 run unit by unit, from uniformity of dosage units, requirement 2.9.40 that mass variation may also satisfy. Deriving the second from the first is possible under strict cumulative conditions, and it is a line of reasoning to document.
The practical consequence holds in one line: representativeness comes from measuring several portions rather than from measuring the same one several times. That is the principle of the multi-increment composite sample.
Three levers answer it, in that order: multiplying and distributing the increments, widening each of them, matching the measurement time to the speed of the flow. None calls for chemometric development: all three belong to the design of the measurement. The levers in detail, a field on which Kim Esbensen works within our network.
Which technology for which case
| Technology | What it follows | Suitable matrices | Calibration burden | Installation | Known condition |
|---|---|---|---|---|---|
| NIR spectroscopy | Content of a constituent, convergence of homogeneity | Powders, granules, tablets | Full for a content. None for content where the criterion is a convergence — but the procedure still validates | Probe in the blender wall, in a feed throat, or multi-point in a transfer section | Probes a few milligrams to a few tens. Sees one portion of the bed |
| NIR in transmission | Content through the whole thickness of the unit | Tablets | Full | Through the unit, in-line or at a check station | Calls for constant geometry and thickness |
| RAMAN spectroscopy | Content, polymorphism, low dosages | Solids, suspensions, aqueous media | Full, or light by following one band | Immersed or contact-free probe | Fluorescence of the matrix. Local heating possible |
| MIR spectroscopy | Composition of a liquid medium | Liquids, emulsions, viscous media | None: pure components | Short path length cell, on a bypass | Short path. Water absorbs strongly |
| Electrical tomography ECT and ERT | Distribution of phases within a volume | Vessels, pipes, opaque volumes | None | Wall electrodes or a fitted belt | Returns a distribution with no model. A content calls for a soft sensor to calibrate |
| Hyperspectral imaging | Map of the constituent across the observed plane | Tablets, powder beds, surfaces | Full, applied pixel by pixel | Camera and dedicated lighting, contact-free | Excellent for comparing zones with one another, and a different proposition on an absolute value |
Transmission now holds production rates. A commercial system published in 2026 measures the active ingredient content of every tablet in three to four milliseconds, at 186 000 tablets per hour, with an RMSEV of 0.89 % and 1.09 % on two formulations and a coefficient of determination above 0.99. What makes that result possible owes as much to the mechanics as to the optics: tablets oriented and singulated, held by air suction, the peripheral zone kept out of the measurement window, calibration spectra acquired under several orientations. Sahara J. et al., International Journal of Pharmaceutics, vol. 690, 2026, article 126516.
With no model, electrical tomography answers where the material is rather than how much of it there is. On a blend in a vessel that is often exactly the right question. Content stays reachable by another route, a soft sensor linking conductivity and temperature to composition, which is a calibration to build and to keep alive.
One remark on the list as a whole. Uniformity is a question of distribution before it is a question of dosage. A conforming mean can cover 0 per cent here and 15 per cent three millimetres away, and a point measurement returns the mean of what it sees. Hyperspectral imaging returns a map instead, which answers the other half of the question. What imaging sees.
The blend stopping criterion, and what it is worth
Two families of criteria coexist, and they do not have the same status.
| Criterion | What it establishes |
|---|---|
| Convergence of a dispersion moving block standard deviation, comparison of variances between successive blocks | That the blend has stopped changing. Calls for no calibrated model: the parameters are set at instrument qualification, the threshold is determined on the product. Block size is a design choice, not a universal constant. |
| Content reached and admissible dispersion value predicted by a model, over several increments | That the blend is at the right content, and sufficiently uniform. Calls for a model calibrated on samples, validated and maintained. It is the only one of the two that can feed a conformity argument. |
The pharmaceutical reference, for its part, remains the dosage unit. The USP <905> uniformity of dosage units test evaluates ten units at the first stage, with a calculated acceptance value, and moves to twenty units at the second. A blend endpoint criterion does not substitute for that test. It can, however, inform it, complement it, and in time be integrated into a documented control strategy.
And the bridge exists: Ph. Eur. 2.9.47, Demonstration of uniformity of dosage units using large sample sizes, allows the demonstration on a count far greater than thirty units — compliance with 2.9.47 standing as evidence that the batch would also meet 2.9.40. It is the chapter written for a PAT environment, and Ph. Eur. 5.25 designates it as such.
On the installation itself, the EMA NIR guideline explicitly names the determination of homogeneity during blending and lists four points to address in the dossier: optimisation of the probe position, estimation of the effective sample size, assurance that the window stays covered with product, and controls against fouling (§ 4.2.1). The four questions a manufacturer asks are those of the text.
What is worth preparing on your side
- The scale of the dose: the mass of one dosage unit and the nominal content. Those two figures decide whether the mass probed by a sensor is relevant at that scale.
- The real position of the measurement point, and its history: a zone that blends, or a zone that fills. An equipment drawing and ten minutes with an operator are worth more than a study.
- Deliberately degraded batches, under-blended and over-blended, where the regulation and the material allow it. A criterion that has met a non-conforming blend is a criterion that has been tried.
- Historical uniformity results, unit by unit rather than the means alone. The current dispersion is what the measurement will be compared against.
- Mechanical access compatible with cleaning and, in pharmaceutical work, with the existing qualification. A new penetration on qualified equipment brings a requalification, best costed at scoping.
- Little material for development: the method is built on a laboratory blender, in 50 to 100 g batches, with the same flange and sapphire window as in production. It also reproduces the reversal of rotation of some industrial blenders. A few batches at industrial scale then complete the transfer.
Conditions for success and limits
A dispersion plateau and a proof of conformity are two statements
A blend can reach a perfect plateau of homogeneity at the wrong content, because a charge was left out or an excipient substituted. Convergence says the process has stopped changing. Where it arrived is established by the content model and by the control strategy.
It is also what the FDA asks of an endpoint criterion: that it be confirmed against a reference methodology, that the detected endpoint not be a transient phenomenon — the rate of change stays below the threshold for a duration or a number of revolutions fixed in advance — and that the assumptions of the statistical test used be met. A variance test between consecutive blocks has them.
Dead zones sit outside both the blending and the measurement
A sensor placed where the powder circulates well sees a homogeneity establishing itself, while a blind corner of the blender stays as it was. Position is what instrument performance builds on, so the location is settled before the equipment, and with people who know the machine.
A homogeneous blend can segregate after the measurement
Transfer, discharge, hopper feed, compression: each of those steps can segregate a conforming blend, particularly where densities or particle sizes differ. Where the stake is the dose, the right measurement point is often downstream, as close as possible to the forming step.
Low dosages are a sampling question before they are a signal question
The lower the content, the larger the mass to probe for the increment to be representative. That is a property of sampling, independent of the technology. A strongly dosed active measures well on a few milligrams. At a few tenths of a per cent, the same increment describes that increment, so the answer is to enlarge the increment mass and multiply the number of them. In a feed frame, 0.1 % steps of a strongly absorbing active have been resolved on a simulator. On a more challenging material, with a weak NIR response or bands overlapped by the excipients, this is checked through a proof of concept.
At a low dosage, convergence can be following the excipients
The point above is about the mass to probe. This one is about what the signal follows. Where the component of interest is a minor one, the spectral variance is dominated by the matrix: a dispersion that converges may be describing the homogenisation of the excipients rather than that of the active.
The FDA states this explicitly for rate-of-change models: for such blends, the endpoint criteria have to establish a uniform distribution of the low-level component itself. It does not read off the shape of the curve — it is checked on the spectral region retained, which has to contain the major bands of the component of interest.
A concentration is not a dose
NIR returns a concentration. Content uniformity is about a mass of active per unit. Going from one to the other needs the mass of the unit — and that is an expectation, not a refinement.
The FDA writes it twice: the model is built on per-tablet reference values with matched weight and concentration; and in routine analysis the result for each tablet is corrected for the weight of that tablet, failing which the approach taken has to be justified. The weight measurement is listed among the information to be filed. A content uniformity measurement by NIR on tablets therefore presumes an individual weight is available, or a written justification for its absence.
The three expectations cited in this section — a non-transient endpoint, the assumptions of the statistical test, and the tablet weight correction — are set out by the FDA, Development and Submission of Near Infrared Analytical Procedures, Guidance for Industry, CDER, August 2021, § IV.C, § IV.F and § V.C; the weight measurement appears at § VII.A among the information to be filed. That document carries the note “Contains Nonbinding Recommendations”: it states the agency’s position, not a regulatory provision.
What it changes, in practice
The gain rarely shows in the cost of the analysis. It shows in three items.
Blending time, when the set point carries a margin: over-blending is a factor of segregation and heating. The rate of uniformity non-conformities, and the cost of the investigations that go with them. A uniformity non-conformity mobilises several departments for several days. And the strength of the dossier: a homogenisation trajectory recorded batch by batch is evidence that a ten-point sampling plan does not provide.
The calculation is made on your own history, during the scoping. It sometimes concludes that the current dispersion is already well controlled and that the investment is not justified. That is a useful answer.
The feed frame, the last window before the tablet
The feed frame is the last operation before compression. Past it there is no powder: there are tablets, and a uniformity drift is locked in rather than observed.
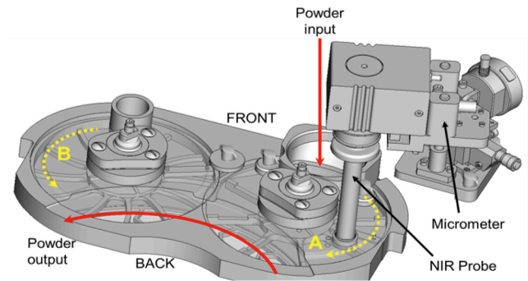
And this is where the opening sentence of this page changes sides. A spectroscopic probe analyses a few milligrams: on a blender that is a reservation to be handled. In the feed frame the powder moves quickly past a small window, and the mass seen in one second of measurement is of the order of the unit dose. The constraint becomes the working scale. What the sensor actually sees.
It is also what the EMA NIR guideline asks to be estimated in the dossier for an on-line measurement: estimation of the effective sample size, alongside optimisation of the sampling device location, the window being covered with sample, and controls to ensure no fouling (§ 4.2.1). In the feed frame those four points are settled in one place, because they all depend on how the powder presents itself at the window.
What is measured there, and what it commits you to
An active content, the uniformity of the stream, and an input for a content uniformity calculation. This is no longer a signature, it is a calibrated prediction — a PLS model, built against a reference method.
The consequence is direct: ICH Q2(R2) applies to the instrument-model pair, with a range established on the population seen in calibration, a reference method frozen and paired with the spectrum, and out-of-range sample detection. What validation asks for, criterion by criterion.
And one condition, reported in the first study of its kind: the measurement depends on how the press is run. Ward et al. find that at low paddle speeds the prediction is biased, and that process parameters have to be optimised for each feed frame geometry. This is not an instrument fault: what changes is the way the powder presents itself.
An RTRT enabler is not RTRT
A feed frame measurement makes real time release testing reachable; it does not constitute it. RTRT calls for a validated method, a documented control strategy and regulatory approval. And once approved it becomes the release route: the European guideline states that where results fail or trend towards failure, end-product testing does not step in to rescue the batch. What the third level of ambition changes.
What the above rests on. The literature first. Potency monitoring in the feed frame has been published since 2013: H. W. Ward, D. O. Blackwood, M. Polizzi and H. Clarke, Monitoring blend potency in a tablet press feed frame using near infrared spectroscopy, Journal of Pharmaceutical and Biomedical Analysis 80 (2013) 18-23, DOI 10.1016/j.jpba.2013.02.008. So has method transfer: M. A. Alam et al., Benchtop NIR method development for continuous manufacturing scale, International Journal of Pharmaceutics 601 (2021) 120581, DOI 10.1016/j.ijpharm.2021.120581 — a calibration built on a benchtop rig from a fifteen-point design of experiments, then transferred to two continuous manufacturing sites and to different instruments, with no readjustment of the model. The same authors document a caveat: an offset on the mean potency can remain, hence their choice to follow the deviation from the process mean rather than absolute potency (Alam and Liu, International Journal of Pharmaceutics 601 (2021) 120521). Development runs on a feed frame simulator, with less than 100 g of material: the proof of concept does not tie up the line. And the mass actually probed in the feed frame is the subject of a dedicated study, for NIR and for Raman: E. M. Hetrick et al., Applied Spectroscopy 75 (2021), DOI 10.1177/0003702820950318. The lag between the feed frame measurement and the tablet is studied by M. Peeters et al., European Journal of Pharmaceutics and Biopharmaceutics 189 (2023) 251-263. Our instrument partners next, who document installation conditions and how the signal behaves during filling. Our own expertise last, on the arbitration: at what depth to set the probe, what acquisition rate to hold, and whether your content is reachable given the NIR response of your active — some actives absorb weakly, and that is what sets the limit, well before the instrument does.
Frequently asked questions
Can content uniformity be derived from blend uniformity?
Under conditions, and they are cumulative. The probed mass has to be representative of the dosage unit, the downstream process has to leave the blend unsegregated, the relation has to have been established on batches covering the real variability, and the reasoning has to be documented in the control strategy. Each of those is demonstrated.
How many measurement points does it take?
The question is the number of increments and their spread rather than the number of sensors. One sensor triggered on every revolution of the blender produces one increment per turn, well spread over time: between 120 and 180 over a fifteen-minute blend at 8 to 12 rpm. Three fixed sensors poorly placed produce the same information three times. Mapping the behaviour of the equipment first costs less than multiplying the hardware.
Is a chemometric model needed?
It depends on the question. For the blend has stopped changing, no: a dispersion is followed and the parameters are set at qualification, the threshold is determined on the product. For the content is 5.0 per cent, yes: a model calibrated on reference values and kept alive. The two routes carry different costs and different lead times. The distinction developed.
What do we do with one outlying value?
Keep it first. An isolated increment that departs can be a measurement artefact, a bubble, a void, a fouled window, or the signal of a real heterogeneity. Telling them apart calls for a spectral diagnosis rather than a judgement: model residuals and statistical distances say whether the spectrum was atypical or whether the content was. That is exactly what the diagnostic statistics are for, and a model that supplies them is the one that defends itself in a regulated environment. This holds for a predicted value. Filtering out disturbed spectra, as a paddle passes for instance, is part of the method and is validated with it.
Does NIR detect a missing charge?
Often yes, and sometimes better than an assay. The absence of an excipient changes the general shape of the spectrum, which shows in the residuals before it shows in the predicted value. That calls for residual monitoring to be in place and looked at, since a system displaying the predicted content alone reads that case as a content.
Does it replace the sampling thief?
In time, that is the objective, and it is one of the strongest arguments for in-line measurement, since the thief disturbs what it samples. The replacement is a method validation project, with a demonstration of equivalence and an update of the control strategy. Many installations live for a long time with both, the in-line measurement steering the process while sampling documents conformity. Validating an analytical procedure.
Tell us the mass of your dosage unit. That is where the arbitration starts.
Forty-five minutes is enough to know whether the mass a sensor probes is relevant at the scale of your dose, which stopping criterion is reachable, and what it would take to go as far as conformity.