
“Where has my reaction got to, right now? Has my emulsion stabilised? What is the actual concentration in this line?” Three questions asked about a liquid, and settled while the medium is still flowing.
The laboratory remains the reference. What changes is when the answer arrives: on a liquid that is reacting, that moment often decides the batch.
Where you meet it: distillation cut, polymer functionalisation, emulsification, in chemicals as in cosmetics.
The essentials in four points
- Answers the fundamental vibrations of the bonds, where the bands of the infrared spectrum are at their most intense and most selective.
- Probes a crossed volume, or a surface: in transmission the beam crosses the medium between two windows; in attenuated total reflection it probes the layer in contact with the crystal.
- Liquid media: reactions, emulsions, suspensions, viscous polymers, measured without dilution, in under a second per spectrum.
- Reference texts: in pharma, Ph. Eur. 2.2.24 and USP ‹854›; outside pharma, ASTM E1655 and D6122.
How the measurement works
Transmission or attenuated total reflection: the two modes do not probe the same thing, and that is the first choice to make, ahead of any setting.
A sensor that sees a film alone carries every question of representativeness, whatever the technology.
Where the instrument sits
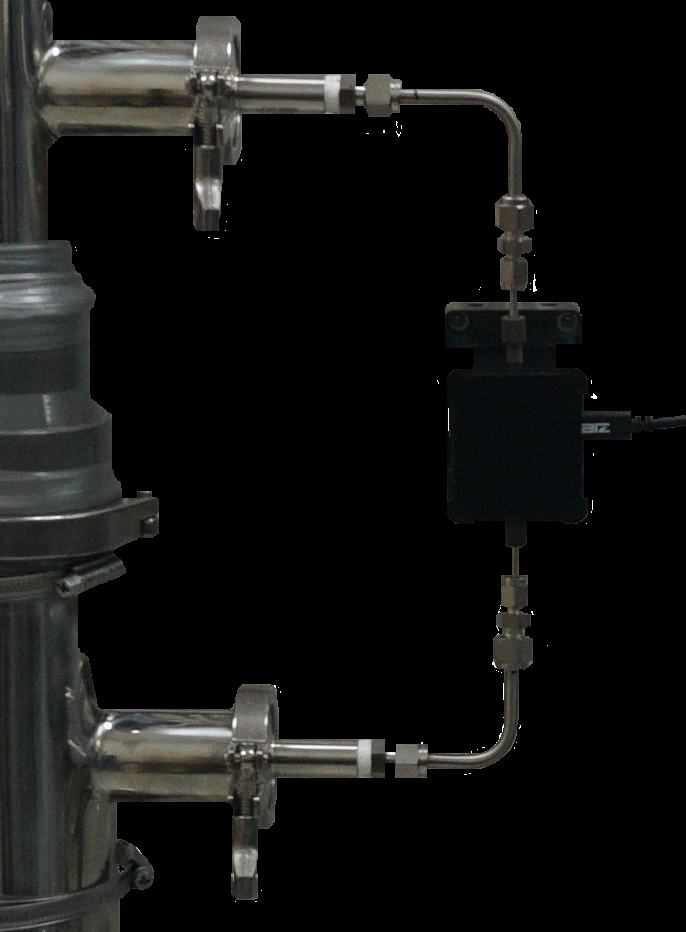
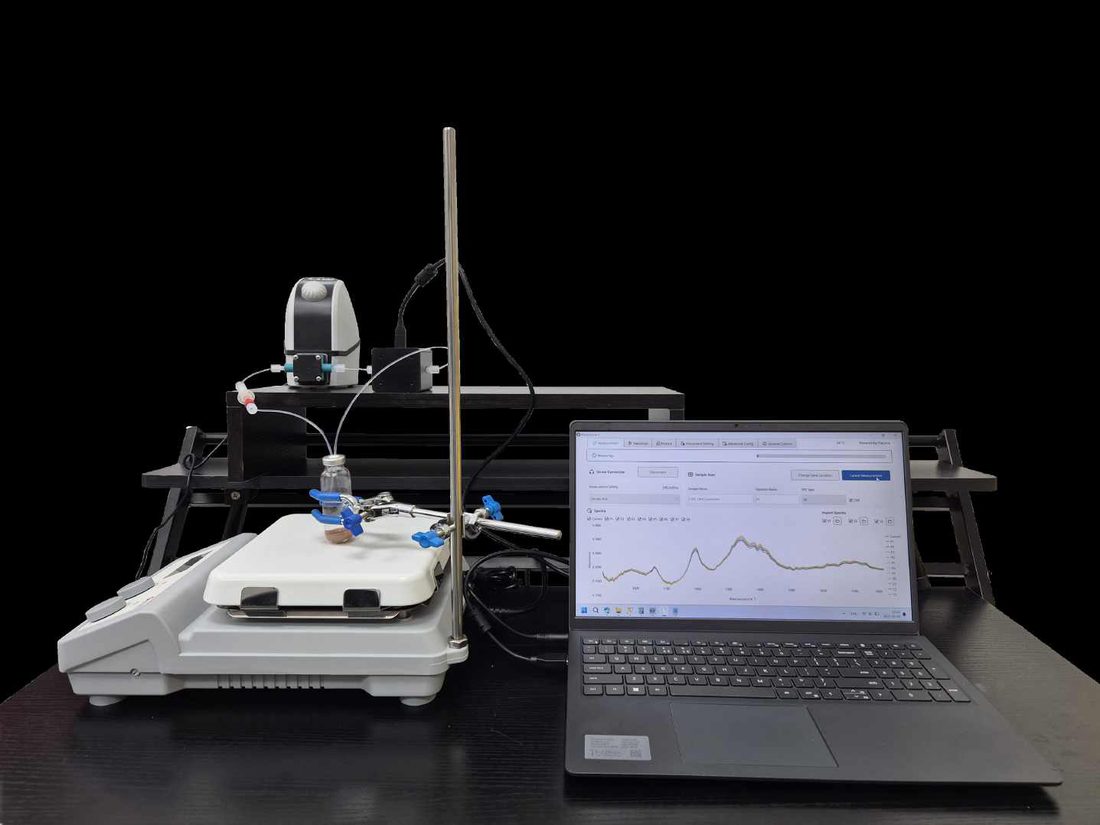
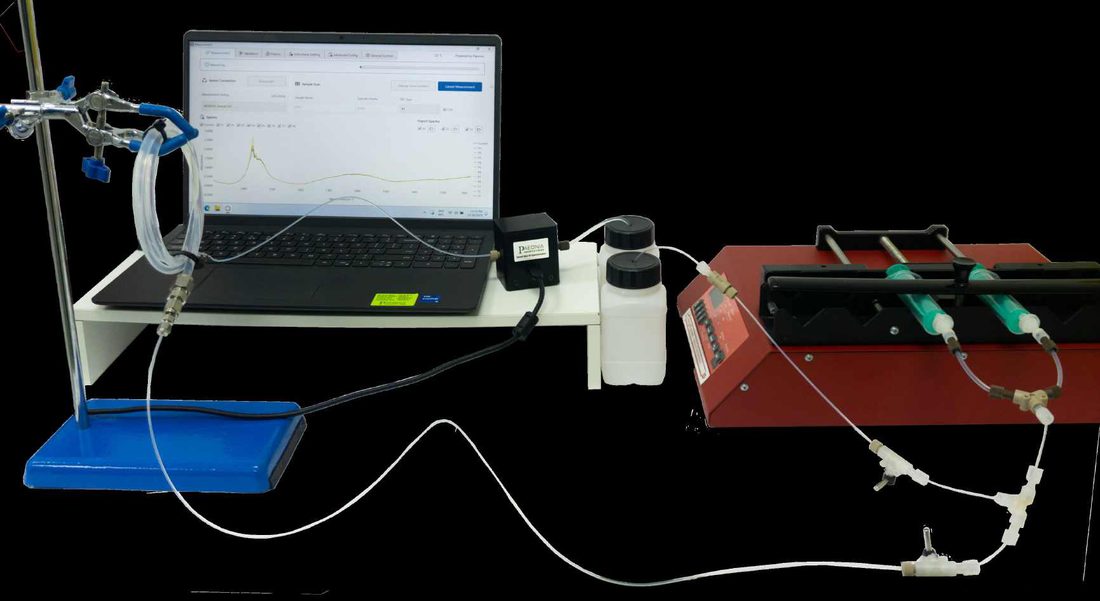
Typical applications
Reaction monitoring
Progress, a stopping point driven by the chemistry rather than the clock, over-reaction avoided.
Composition of a liquid
Concentration of a constituent, stabilisation of an emulsion, a constituent running out in distillation.
A real case
A crystallisation known only afterwards: the trajectory becomes visible during the operation.
What is documented to date is set out plainly further down.
Identity card of the technique
| Criterion | Transmission MIR |
|---|---|
| What the measurement sees | The fundamental vibrations, not their overtones: the molecular fingerprint. In a volume crossed right through, not in a surface film. |
| Selectivity | Excellent. Well-separated fundamental bands, where NIR sees only overtones that overlap. |
| What interferes | Water absorbs strongly — it is the very short optical path, a few tens of microns, that makes it bearable. And in the fingerprint region, solvent, reagent and product bands overlap. |
| Sample presentation | A short-path cell placed on a recirculation loop. Liquid media, viscous and opaque included, filtered upstream. |
| What the model requires | A chemometric model as soon as bands overlap. Following a single isolated band can be enough for a switch point. |
| Reference texts | In pharma: European Pharmacopoeia 2.2.24. At the USP, the enforceable chapter ‹854›, paired with an informational ‹1854›. Outside pharma: ASTM E1655 to build the calibration, ASTM D6122 to validate an on-line analyser. |
Transmission or attenuated total reflection: what changes
| What is compared | Attenuated total reflection (ATR) | Transmission |
|---|---|---|
| What is probed | A surface, over a small penetration depth | A volume, crossed right through |
| In a heterogeneous medium | The layer seen describes that layer | The real chemical composition of the medium |
| Viscous products | Contact takes work to guarantee | Takes viscosity in its stride |
| Fouling | The crystal fouls and the signal follows | Cleaning built into the process |
Why the short optical path is what makes water workable
The very short optical path is what makes water tolerable. In MIR, water absorbs strongly. Over a path of a few centimetres it saturates the detector. Over a few tens of microns it passes enough light for the rest of the medium to express itself.
It is a design argument, and it runs against the intuition. A short path opens aqueous media and suspensions rather than closing them, while keeping the advantage of measuring a volume.
What these instruments contain
| Characteristic | What is announced |
|---|---|
| Format | From 450 g for the standard model to 900 g for the high-pressure version; 5 × 5.5 × 6 cm for the standard |
| Spectral range | 900 to 1800 cm⁻¹ or 1800 to 3500 cm⁻¹, depending on the version ordered. One instrument carries one or the other; covering both calls for two devices in sequence |
| Acquisition | One spectrum every 0.3 second at the fastest |
| Architecture | No moving part, no cooling, no optical fibre |
| Wetted parts | 316L stainless steel and Hastelloy C-22, FFKM, germanium, gold and silicon |
| Connectivity | USB-C and OPC-UA; Ethernet and TCP/IP on the Plant model; SPC and CSV export |
| Long-term stability | Over 100 days, with a cosine similarity of 0.9999 or above — on the raw voltage signal, not on absorbance |
| Viscosity and temperature | Up to about 10,000 cP, up to 60 °C |
Instrument: OrionIR, by Paeonia Innovations. Sources: Paeonia’s Current Models Specifications sheet, 8 September 2026, for format, wetted parts, connectivity, viscosity and temperature. Paeonia’s brochure, October 2025, for acquisition rate and architecture. Clarifications from Paeonia, 14 September 2026, for the spectral range by version and for what the stability figure measures. The 0.3 s cadence and the wetted parts also appear in Paeonia’s public presentation to the Flow Microreactor Meeting 113, 31 July 2026.
Four lines in that table worth reading twice
No moving part, no cooling and no optical fibre removes three frequent causes of downtime for a spectrometer in an industrial setting. Stability beyond a hundred days is measured on the instrument’s raw signal: it says the electronics do not drift, which is what allows re-verification to be spaced out — not that a method stays accurate, which is demonstrated on absorbance and on your own matrix. And the spectral range decides what is visible, but it is chosen at order time: 900 to 1800 cm⁻¹ for the fingerprint region and the C=O band, 1800 to 3500 cm⁻¹ for the C-H, O-H and N-H stretches. That is a trade-off to settle before purchase, on the bands your measurement needs.
The announced rate is a ceiling, not a working setting. At 0.3 second per spectrum the signal-to-noise ratio sits at the edge of degradation. We work at 0.7 second, which gives the best signal-to-noise and still runs well ahead of what most processes ask for. A spectrometer’s top speed is not chosen for its own sake: it is chosen against noise, and the right setting is the slowest one your process tolerates.
The mechanical integration, documented
The installation drawing goes to the end of the loop.
- A recirculation loop with a bidirectional gear pump, which brings the medium to the cell and returns it to the process.
- An in-line filter, which protects the cell from the particles that could block it.
- A three-way valve, which switches between process, cleaning and calibration.
- A clean in place, followed by drying with nitrogen or dry compressed air.
- An in-line system check using calibration products, with the process running.
That last point changes an installation. How you verify that the instrument is still telling the truth six months on is the question many projects settle late. A mechanical answer, a valve, a calibration product and a procedure, carries further than a stability promise. It lets you keep a model alive with production running.
What is documented today, stated plainly
Two in-line applications, and two off-line applications whose route to in-line is set out. Those are different things, and the distinction belongs here rather than in the customer’s discovery.
| Application | Stage | What is demonstrated |
|---|---|---|
| Emulsification | In-line, real time | Continuous following of surfactant addition through to stabilisation. Shows that emulsification is a delayed rather than an instantaneous process, and opens an endpoint criterion driven by the chemistry rather than by the clock |
| Fractional distillation | In-line | Direct and inverse calibration. Real-time detection of a constituent running out |
| Hydrogen peroxide | Off-line, route to in-line set out | Assay in aqueous phase. The working range is established on your product, at trial |
| Polymer functionalisation | Off-line, route to in-line set out | Following the degree of substitution on viscous media measured with no dilution, where titration, magnetic resonance and chromatography return their result after the reaction has moved on |
The emulsification case is the most instructive. It measures faster, and it also shows a behaviour the usual methods leave unseen. The bands of the oily constituent appear only after a measurable delay, so a blend stopped when it looks blended can be stopped early. The endpoint criterion becomes chemical, and so defensible.
The domain of the technique, and the domain of the instrument
The two are not the same, and the gap between them is settled at the order.
The domain of the technique is described by USP in its technical guide on drug substances in continuous manufacturing: the mid-infrared spectrum is sensitive to the physical and chemical state of the constituents between 400 and 4000 cm⁻¹, and the region below 1500 cm⁻¹ is what is called the fingerprint region: the absorptions there come from complex interacting vibrations, which gives each compound its own identifiers.
The domain of the instrument is narrower. Against that split, the 900–1800 cm⁻¹ window covers the fingerprint region and reaches just above it to catch the C=O band; the 1800–3500 cm⁻¹ window sits entirely outside the fingerprint and serves the C–H, O–H and N–H stretches. The table above already says as much; what the reference adds is the numbered boundary that lets you choose between the two versions.
The same text states the lower limit of the technique: substances at very low concentration are difficult to determine, the noise level becoming a problem in that region. That is the first point to set against your specification, before the choice of window.
And it gives the example that speaks most directly to a synthesis chemist: Fourier transform mid-infrared separates a drug substance from its impurities — the decomposition of acetylsalicylic acid into salicylic acid, which the odour of acetic acid often signals first. Following a reaction while it runs.
USP Technical Guide, Control strategy for continuous manufacturing of drug substances, © 2025 The United States Pharmacopeial Convention, Rockville, MD — § 2.4.5. An informational document: it carries no requirement.
Where another route serves better
Saying so is part of the work of an integrator. Here are the bounds, as they stand.
Liquids, and a medium that can circulate
A powder, a granule, a tablet belong elsewhere than in a short-path cell. For those matrices the answer is most often NIR spectroscopy, which takes divided solids. The medium here circulates, or is presented in liquid form.
Water is tolerated, and it still occupies part of the spectrum
The short path opens measurement in an aqueous medium, and water keeps its own regions of the spectrum. At high water contents the usable window narrows and the quantitative performance follows. Worth verifying on your real media rather than on a model solvent.
A calibration range has bounds, and the supplier writes them
The application notes state the concentration ranges the models were built on, with the explicit note that beyond those bounds the model saturates. That is good practice, rare enough to be worth pointing out.
The consequence is simple. A model is used inside its domain, which calls for out-of-domain detection alongside the display. That belongs to analytical procedure validation, and it is settled when the model is built.
A short-path cell asks for a filter and a clean in place
A few tens of microns leave little room for agglomerates or precipitates. So the integration drawing carries an in-line filter and a clean in place. On a loaded medium, the design of the loop is the project.
Which kind of model, and what it implies
Both routes are documented here, and the choice follows what you know of your medium.
The pure-component model decomposes the spectrum onto the spectra of the pure components. It calls for a known and declared composition, and it is built with very few process samples. The model calibrated on samples regresses on reference values, and calls for a population representative of the real variability. The high chemical specificity of MIR favours the first route more often than NIR allows, which is a real economic advantage. The full reasoning: pure-component model or model calibrated on samples.
The instruments we implement
PAEONIA, MIR spectroscopy. Laboratory configurations and cells integrable into a process, for continuous measurement on liquid media.
Frequently asked questions
Why transmission rather than an ATR probe, which is more widespread?
ATR works well in homogeneous media that do not foul, which is why it is widespread. Transmission takes over when the medium is heterogeneous (an emulsion, a suspension, a medium that separates) or when a deposit forms: it crosses the volume, gives the real composition, takes viscosity in its stride and cleans in the process.
Can an aqueous medium be measured in MIR?
Yes, and the very short optical path is precisely what allows it. Over a few tens of microns, water passes enough light for the rest of the medium to express itself. The window narrows at high water contents. That is verified on your real samples.
How many samples does the model need?
It follows the route chosen. A decomposition onto pure components needs the spectra of those components and a declared composition. A regression on reference values needs a population covering the real variability of the process, which runs to dozens of samples. The question is settled at scoping.
What happens where a measurement leaves the calibration range?
The model saturates and the value it returns sits outside its founded range, without necessarily saying so. That is why out-of-domain detection is part of a serious deployment. The supplier writes the bounds of its ranges itself. That information belongs in your control strategy rather than in an application note.
Does production have to stop to verify the instrument?
Not where the loop is designed for it. The three-way valve sends a calibration product into the cell while the process continues, then switches back after cleaning and drying. That is a constraint to build into the mechanical design, and it weighs far less than a planned shutdown every quarter.
How does the instrument interface with the control system?
USB, OPC-UA and ASCII export are announced. OPC-UA is the point that counts for a feed to a supervisor or a historian. Data and records management is settled at another level than the protocol. See what "21 CFR Part 11 ready" means, and what it leaves with you.
What is the first deliverable of a project on this technology?
A measurement on your samples, in the laboratory, before any integration. It answers the one question that counts at the start: does the signal separate what you want to follow. Going in-line, the recirculation loop and the cleaning come after, and they are costed once feasibility is in hand. That is the logic of the proof of concept.
Describe your liquid medium. You will hear whether transmission sees it.
Forty-five minutes is enough: placing the feasibility, saying whether the water content or the particle load calls for care, and framing what the integration loop supposes on your side.