
“Is my substrate running out? Where has the culture got to between two samples? Can I follow the medium without opening the circuit?” Three questions that arise, and are settled, during a ten-day culture.
The off-line assay remains the reference: its value is the one on which the in-line measurement is qualified, then verified.
Where you meet it: cell culture in biopharma, microbial fermentation, preparation of buffers and media.
The essentials in four points
- A laser sweeps the wavelengths one at a time and makes workable a spectral region three to five times more absorbing than the overtone region.
- A fixed optical path, at 1 mm: the interaction length is a mechanical constant, not an unknown to be absorbed into a model.
- “No calibration” does not mean “no chemometrics”: the pure-component model does exist, and it works. We would rather say so before the demonstration than after commissioning.
- Bioproduction only: culture media, buffers, nutrients, on a closed sterile circuit. Reference texts: those of NIR.
How the measurement works
A classical spectrometer lights the sample with a broad source, then sorts the wavelengths. Here the source emits one wavelength at a time and sweeps it: all the energy sits on the wavelength being measured.
Where the instrument sits
Typical applications
Composition of a liquid medium
Substrates, metabolites and nutrients of a culture medium, followed without sampling.
Following a culture
Substrate, metabolites and nutrients followed continuously, between two samples.
Application examples
In-line measurement of buffers, and monitoring of cultures and fermentations.
Outside bioproduction, or where the composition cannot be declared: NIR and transmission MIR.
Identity card of the technique
| Criterion | NIR-HPTLS |
|---|---|
| What the measurement sees | The same range as NIR, but the wavelength is selected at the source — a gallium antimonide gain chip and a tunable Fabry-Pérot filter — and swept, rather than sorted afterwards. |
| Selectivity | That of NIR, lifted by a pure-component model: the instrument decomposes the spectrum over a library of components acquired one by one. |
| What interferes | Any absorbing constituent that is not declared. The model does not find what it is not looking for: an unanticipated impurity goes into the residual, not into the result. |
| Sample presentation | Immersed probes, sterilisable or single-use, in bioproduction: cultures, buffers, nutrients. That is the only field this family addresses. |
| What the model requires | On a defined medium, no design of experiments: a library of pure-component spectra, acquired in the real solvent with traceable standards, transferable from one instrument to another without recalibration. In a living culture, metabolites, biomass and product come in: the decomposition is completed by a calibration on samples, and viable cell volume or titre call for a calibrated model. |
| Reference texts | In pharma: it is NIR: European Pharmacopoeia 2.2.40, and at the USP ‹856›, which carries the requirements, completed by the informational ‹1856›. Outside pharma: ASTM E1655 and ASTM D6122, written for infrared, apply. |
Where chemometrics sits in this measurement
The calculation is published, and it is simple to describe. The instrument has a library of pure-component spectra, acquired one by one in the real solvent from standards. At each measurement, it looks for the set of concentrations that, recombined from that library, best reproduces the observed spectrum. The fit is made by least squares, with a quadratic term per component that accounts for departures from proportionality. That quadratic term is itself determined by calibration, from a dilution series.
Decomposing a spectrum onto pure components and fitting by least squares is chemometrics. This is not an opinion: the method has a name, CLS — classical least squares — and Ph. Eur. 5.21 Chemometric methods applied to analytical data explicitly lists it among the chemometric methods it describes, alongside “MCR-ALS, PCA, PLS, CLS, ICA, etc.“, and defines it in its own glossary. A library of pure spectra is a calibration. A dilution series is a calibration campaign.
We refuse the expression “without chemometrics” because it would discredit us in front of the only audience that decides. A chemometrician, a validation manager, an assessor. Correctly reformulated, the argument becomes stronger.
Two invoices, two calendars
The model stays. What changes is where the entry price is paid. A model calibrated on samples asks for a design of experiments representative of the population you will meet later: batches, seasons, suppliers, months. A pure-component model asks for something else, an exhaustively declared composition and a qualified library, measured in the right solvent with traceable standards.
Two invoices, two calendars, two things to watch. Our work is to say which of the two your process belongs to. The conditions of validity of each.
The optical arrangement, in detail
A grating or an interferometer sorts wavelengths after the fact. Here the selection happens at the source. The emission comes from a gallium antimonide gain chip, paired with a micro-machined tunable Fabry-Pérot filter: two facing mirrors whose spacing is set electrically, which selects the wavelength that leaves the device. The tuning covers 200 to 300 nm, with a line width of 0.1 to 1.0 nm and a step of 0.01 nm. The instrument runs twenty-five sweeps in under a second.
On the noise gain the manufacturer publishes one comparison: a standard deviation of 11.8 µAU for its measurement against 234.9 µAU for a Fourier transform spectrometer. Worth knowing what that comparison covers, and the section below returns to it.
What the pure-component model really earns you
Quick commissioning
No design of experiments covering the future population, no campaign of paired samples, no waiting for a demanding batch or a season. Once the library is available and qualified, commissioning is quick.
Transferability between instruments
The model is physical rather than statistical: it describes the spectra of molecules rather than the optical particularities of one device. A second instrument, a second site start from the same library, with no recalibration.
Legitimate extrapolation
Within the range covered by the dilution series, the prediction stays founded. A model calibrated on samples holds inside the domain of its calibration, and keeping it there is what asks for attention over the years.
What to establish before you commit
A monitoring instrument for a known recipe
This is the exact counterpart of the advantage above, and the manufacturer writes it itself. The user states which components are present in the mixture, and the method reads that declared list. An unanticipated impurity, a degradation product, a contaminant: the algorithm spreads their absorption over the declared components, so each concentration shifts slightly. The technology follows a known recipe, and investigation belongs to another method. Knowing that at the outset is what makes it the right tool where the recipe is fixed.
What the library has to cover for the measurement to stay true
The strongest published level of evidence is a conference communication co-signed with an industrial partner, with the instrument moved on site and an independent reference method. It carries one outlying point. On an excipient, chromatography gives 0.40 mg/mL against 0.59 mg/mL in line, a spread of 48 %. The manufacturer attributes it to the recovery of the reference method without demonstrating it. On another constituent, a bias reaching −18 % according to the matrix. That is the classic signature of a pure-component library that is still to account for every interaction between constituents, which makes the library qualification the place to invest. And it is a conference communication, not a peer-reviewed publication.
What the published comparisons cover
The published standard deviations set this measurement against a Fourier transform spectrometer and broadband sources. A comparison against a dispersive grating spectrometer, an architecture widely used in process measurement, is one to request. The demonstrated advantage stands against two architectures, and the third is worth asking for.
The analytical performance figures to request
Prediction error, limit of detection and limit of quantification for each constituent, a stated response time: these are the values an analytical procedure validation file expects in the sense of ICH Q2(R2). They are obtainable. They are asked for, in writing, on your matrix, before any commitment.
The spectral residual, and why to use it
At every measurement the instrument computes the gap between the observed spectrum and the spectrum reconstructed from the library, and publishes that value. It is an intrinsic quality metric, produced measurement by measurement, with no external reference and no intervention.
Functionally it is a Q residual, one of the two or three indicators most used to watch a chemometric model and detect an out-of-domain sample. The multivariate regression has been set aside and the most important chemometric diagnostic has been kept. That is coherent, and it is the best demonstration that the two approaches work together.
The operational consequence belongs in the control strategy. A rising residual signals that something is happening in the medium which the library is still to describe. It is the warning you have where an undeclared component appears, and it earns its keep once someone is named to watch it. What keeping a model alive means.
Where this technology is at home
| Situation | Verdict |
|---|---|
| Liquid of known, finite and declarable composition | Its reference domain. The five conditions of the pure-component model are met. |
| Bioproduction medium, following substrates and metabolites | Suited, with probes compatible with sterility constraints. See the biotech sector. |
| Biopharmaceutical formulation, in-line composition control | Suited, once the analytical performance for each constituent has been obtained. See the pharma sector. |
| Natural matrix, variable or open-ended | Another route. The composition of an agricultural product is not declared: that is a model calibrated on samples, so NIR spectroscopy. |
| A quantity other than a concentration, viscosity, particle size, use property | Another route. There is no pure spectrum of a physical property. |
| Searching for an unknown compound or an unanticipated contamination | Another route. The method reads a declared list, by construction. |
| Powders, granules, divided solids | Another route. The fixed optical path implies a liquid. |
Frequently asked questions
Do all the components of the medium really have to be declared?
All those absorbing significantly in the swept range, yes. That is the real preparatory work: establishing the list, obtaining the pure components, acquiring their spectra in the real solvent with traceable standards, and qualifying the resulting library. This work replaces the design of experiments of a model calibrated on samples. It takes its place rather than adding to it.
What sets the time before a usable measurement?
Once the library is available and qualified, commissioning is quick. The lead time has moved rather than vanished: it now sits in building that library and in verifying that the declared composition is complete. What a proof of concept covers.
Can it be used to release a batch?
It is an alternative analytical procedure, and the framework exists: ICH Q2(R2) for validation and ICH Q14 for development. Accuracy, precision, specificity, range and robustness are to be demonstrated, which means producing exactly the figures listed above. That is a validation project in its own right rather than a consequence of the installation.
Which questions to put to the supplier before committing?
Five, and in writing.
- Which prediction error on my matrix, against which reference method?
- Which limits of detection and quantification for each constituent?
- Which real response time, and under which conditions?
- How does the spectral residual behave when an undeclared component appears?
- Which transfer procedure between two instruments?
A written answer is what you are after, and the answer you get is itself informative.
And where my composition is open-ended?
Then another route serves better, and forty-five minutes is enough to establish it rather than a trial. A medium whose composition varies, carries unidentified constituents or moves with the raw material belongs to a model calibrated on samples. The conditions a non-destructive measurement holds on.
The instruments we implement
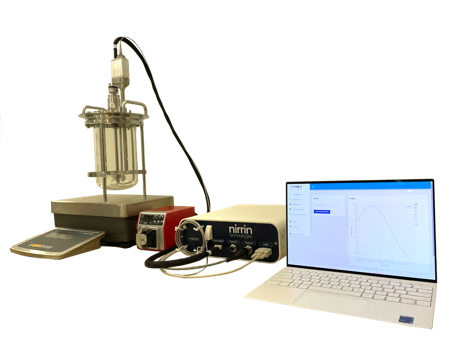
NIRRIN
Sterilisable and single-use probes, designed for bioproduction environments and compatible with sterility constraints.
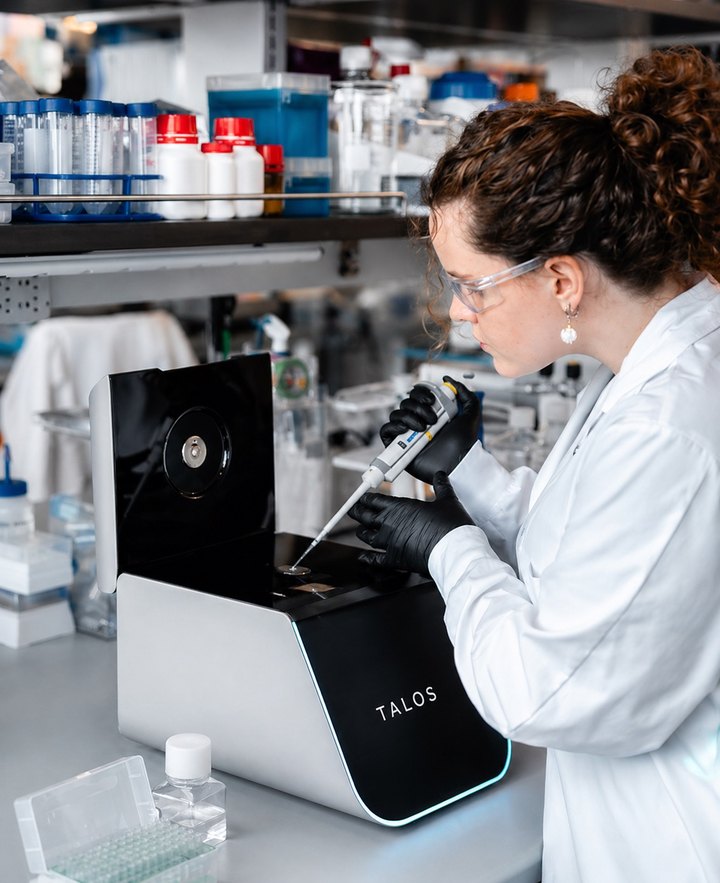
TALOS — direct protein quantitation from 0.1 to 250 mg/mL, with no dilution, no calibration and no extinction coefficient to establish molecule by molecule. Fixed optical path.
What we bring around the instrument: establishing the list of components to declare, qualifying the library, and setting up the monitoring of the spectral residual. Along with the analytical performance questions put to the supplier before the purchase rather than after.
Tell us what your medium contains. You will hear whether the pure-component model applies.
Forty-five minutes is enough. Whether your process belongs to the pure-component model or to a model calibrated on samples, what each would take to put in place at your site, and which analytical performance to write into the specification.