
The sensor is installed, it steers well, the operators trust it. Then someone asks whether it could release a batch. And the file holds nothing that would let the answer be yes.
That is the moment when a sensor that steers and an analytical procedure supporting a conformity decision turn out to be two different things. Between them sits a project: protocols, samples, acceptance criteria, report.
Many installations deliberately stop before that project, and it is a defensible choice as long as it is named and written down. What stays worth avoiding is letting a steering use slide towards a regulated one without saying so.
In short
It all depends on what the measurement decides. Controlling the process requires no formal validation: a stable signal and periodic verification are enough. Documenting evidence requires a described method and accuracy demonstrated against the reference. Replacing a release test requires full analytical validation and the agreement of the authorities, and that project is decided before the sensor is bought.
Three levels of ambition, three different projects
The first question is what decision the measurement has to support, rather than what precision it reaches. The answer commands number of samples, duration and documentation.
Steering the process
The measurement runs an operation: stopping a drying, extending a blend, adjusting a flow rate. It appears in no batch record as an acceptance criterion. What it takes: a stable signal, a reliable installation, a periodic verification. The majority of installations live very well here.
Documenting evidence
The measurement enters the file as knowledge: a homogeneity profile, a drying curve, evidence of control. It supports a justification without carrying the decision alone. What it takes: a described method, traced data, accuracy demonstrated against the reference. A real file, and a bounded one.
Replacing a release test
The measurement becomes the result a batch is accepted on. What it takes: a full analytical validation, an updated control strategy, change management, agreement from the authorities. A project in its own right, decided before the sensor is bought.
Moving from one level to the next is never automatic. A sensor that has run for two years does not become a validated method. Evidence of use says the installation holds, rather than that the value is accurate, precise and defensible within a defined domain.
Decide the level you are aiming at during scoping. Aiming at the third changes the design of the installation itself: probe position, redundancy, traceability, compliance architecture. Planning for it costs far less than retrofitting.
Outside pharma, the same rigour is shown to a different audience
In food, chemicals and cosmetics no regulator approves a measurement procedure. The demand comes from elsewhere: from an audit scheme — IFS, BRCGS, FSSC 22000, ISO 22716 — or from a customer specification written by people who read a validation report perfectly well.
The consequence is a good one. None of the above is compulsory there, and all of it is defensible: a procedure validated along the lines described here stands up to any auditor, and it sets you apart precisely because it was not required. The texts for each sector.
The ICH Q2(R2) criteria, applied to a procedure that predicts
ICH Q2(R2) defines what is expected of a validated analytical procedure. Its criteria apply to a multivariate spectroscopic procedure, and their content changes, because here the quantity is predicted rather than measured. The instrument records an absorption and a model translates it into a content, so the validation bears on the instrument and model together.
| Criterion | What it becomes for a multivariate procedure |
|---|---|
| Specificity | Demonstrating that the prediction responds to the constituent sought rather than to a correlated factor: compaction, particle size, temperature. The hardest criterion and the most often rushed, since a model can predict accurately for the wrong reason, until the correlation moves |
| Accuracy | The gap between predicted value and reference value, on samples that were not used to build the model. The reference method is frozen before the first acquisition, since changing its conditions changes the quantity validated. And it is paired with the spectrum, which is what makes the measured accuracy mean something. That reference also carries an error of its own, and it is determined first: it is the floor the prediction will be compared to |
| Precision | Repeatability and intermediate precision. The point to watch: repeating the measurement in the same place tests the instrument noise. Useful precision is assessed over several portions of material, on different days and with different operators |
| Range | The span over which the procedure is declared valid. For a model calibrated on samples that range is established from the population seen in calibration rather than decreed. Calibration is deliberately wider than the range claimed: the calibration set covers the widest span, the internal validation set the next widest, and it is the latter that bounds the declared working range. Beyond it the prediction carries no guarantee, and it still comes out |
| Linearity | The relation between predicted and reference values over the range. It is examined on the residual plot as much as on the correlation coefficient, which can be excellent alongside an error structure worth revisiting |
| Robustness | Behaviour under normal variation: temperature, raw material batch, ambient humidity, window fouling, a lamp replaced. This is where in-line procedures part company with laboratory ones, since those perturbations are met on the floor rather than simulated at a desk. They are planned for: a spare instrument and lamp ageing, temperature ± 5 °C, humidity ± 10 % RH, optical bench stability; on the material side, packing density, path length, quantity presented; and the operator. By design of experiments or one factor at a time. The useful criterion is plain: the decision does not change. Q2(R2) in fact places this criterion with method development, in the sense of ICH Q14 discussed below, rather than with validation itself: it is demonstrated upstream, and documented. |
Specificity has a verification criterion, and it is written down
Saying a criterion is hard does not say how it gets met. The FDA gives the conventional method: specificity is taken as verified if the main features of the model’s loadings plots correspond to those of the NIR spectrum of the analyte of interest — that reference spectrum being pretreated exactly as the model’s spectra are. Put plainly: the model has to rest on the molecule’s own bands, and that can be looked at.
Two additions from the same text. The ability to reject outliers — high leverages, high residuals — is a second element of specificity. And for a process endpoint criterion, the demonstration runs through the fact that the wavelength region retained contains the major bands of the components of interest.
FDA, Development and Submission of Near Infrared Analytical Procedures, Guidance for Industry, CDER, August 2021, § V.B and § V.C. Carries the note “Contains Nonbinding Recommendations”: the agency’s position, not a regulatory provision.
A pure-component model, built on pure component spectra, moves some of those criteria without removing them. Specificity rests on the physics rather than on a population, and accuracy and robustness are still demonstrated on the real process. The calibration burden shapes the content of the file.
Cross-validation or a test set: what each figure is worth
Two numbers circulate under the same name of “model performance”, and they do not compare. Knowing which one you are reading is the first question to put to a chemometrics report.
Cross-validation chooses the model’s complexity
A fraction of the samples is removed, the model is rebuilt, the removed fraction is predicted, and the cycle repeats. It is the tool that answers one question: how many latent variables to keep? At that job it is sound, and there is nothing better when samples are few.
What it does not do: estimate the error you will meet tomorrow. Every sample helped build the model on one of the rounds.
An independent test set estimates the prediction error
A share of the samples is set aside before any model building, and is run once only, with the model locked. That is the figure that can go into a dossier, because it took no part in what it evaluates.
The price is real: samples withheld from calibration. It is a trade-off, and it is decided at scoping, not at the end.
Three independent sources say the same thing, and they do not come from the same world. The FDA guidance of August 2021 on NIR analytical procedures is the most direct: “Internal validation of the chemometric model is not considered a substitute for external validation.” A USP technical guide of 2023 on continuous manufacturing recommends the independent test set, “which is less biased than the error obtained from the training set”. And a study monitoring anaerobic digesters by near infrared, published in Journal of Chemometrics in 2011, publishes its four-component models with a relative prediction error established on a test set — where the same measurement under cross-validation would have looked better.
Two habits that change what the figure is worth
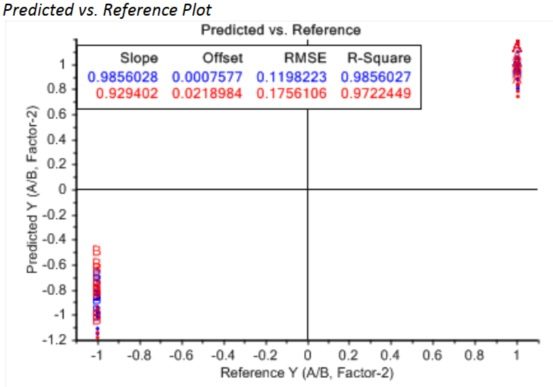
Publish the slope alongside the correlation. The slope of predicted against reference carries accuracy, the coefficient carries precision. A coefficient on its own does not say whether the model is systematically wrong in one direction.
Group replicates in the split. Where several spectra correspond to a single reference value — the case of any continuous acquisition against a discrete sample — the split has to remove the whole group. Otherwise the same reference value sits on both sides, and performance rises mechanically without the model having learnt anything transferable.
“Independent” does not mean the same thing in the three texts
On the principle the texts agree: an external set, run once, with the model locked. They do not set the bar in the same place for what makes a sample independent, and the gap is paid when the campaign is designed, not when the report is written.
- ICH Q2(R2), carried verbatim into the ICH Q14 glossary — the lowest bar: “Independent samples can come from the same batch from which calibration samples are selected.” The body of ICH Q14 adds that a set built from independent batches is what demonstrates robustness. The two levels are distinguished there, not merged.
- USP <1039> — the bar sits at the batch, and the verb binds: “any batches used in calibration and cross-validation must not be considered or reused as an independent dataset for method validation”.
- The EMA NIR guideline — the highest bar: the external validation set “should not be taken from the same (historical) population as those batches used to generate the calibration model”, and it covers pilot and production-scale batches where possible.
The consequence is settled before the first acquisition. A validation set designed on the ICH Q2 definition alone can satisfy that text without satisfying USP or EMA. The scoping question is therefore not “how many samples do we set aside” but “at which level: the sample, the batch, or the campaign”. How the set is built, dimension by dimension.
ICH Q14, glossary entry “Independent sample” and the section on calibration and validation sets; USP <1039> Chemometrics; EMA, Guideline on the use of near infrared spectroscopy…, EMEA/CHMP/CVMP/QWP/17760/2009 Rev. 2, 27 January 2014.
Sources: FDA, Development and Submission of Near Infrared Analytical Procedures, Guidance for Industry, CDER, August 2021, § V — the document carries the note “Contains Nonbinding Recommendations”; USP Technical Guide, Control Strategies for Continuous Manufacturing of Solid Oral Dose Drug Products, 2023, § 4.3.5, published for information; J.B. Holm-Nielsen and K.H. Esbensen, J. Chemometrics 25 (2011) 357-365.
Identifying a material: the proof is built on the look-alikes
Everything above describes a procedure that predicts a quantity. The first industrial use of near infrared lies elsewhere: recognising a raw material on receipt, confirming that a container holds what its label announces. ICH Q2(R2) covers identification procedures too, and validating one looks nothing like validating an assay. No accuracy, no linearity, no range: a binary decision, and a confusion matrix.
What makes the proof is not the correct samples, it is the look-alikes. A procedure that tells lactose from paracetamol has demonstrated nothing. The true negatives of an identification study are the materials that could genuinely be confused: structural analogues, salts, polymorphs, other active ingredients present on site, neighbouring excipients, and packaging materials wherever a mix-up is possible. Choosing those materials is what decides the worth of the study.
| What is demonstrated | On what |
|---|---|
| Sensitivity | The share of conforming materials correctly identified. Over several batches, several suppliers, several manufacturing routes where they exist, with the normal variability of moisture and particle size. |
| Specificity | The share of materials to be set aside that are effectively set aside. This is where the worth of the procedure is decided, and the choice of look-alikes is what makes it. |
| Agreement with the test in place | The concordance rate of the decisions, completed by an agreement index that corrects for chance. A specificity at least equal to that of the compendial test makes equivalence arguable for that identification. |
| Robustness | The decision stays the same when the instrument, the operator, the temperature, the humidity, the packing or the sample presentation change. |
Two elements frame the whole and are written before the first acquisition. The acceptance criteria: the false positive and false negative rates accepted, justified by the risk carried by a misidentification. And the numbers: a few tens of samples per class, so that the estimated rates carry statistical meaning.
The US pharmacopoeia sets this exercise apart. Its chapter <1225> sorts procedures into four categories, and Category IV is the one for identification tests: it asks for specificity, and asks for neither accuracy, nor precision, nor linearity, nor range. The table above is therefore a complete validation rather than a reduced one.
ICH Q14: validation starts at development
ICH Q14 covers the development of analytical procedures and carries an idea that changes how a project is run. A procedure is designed from knowledge of what it has to measure and of the sources of variability that affect it, rather than from a data set processed afterwards.
In practice, write first what the procedure has to be able to do: which quantity, over which range, with what tolerable uncertainty, under which conditions. Then build the sampling plan that will demonstrate it. The factors to vary deliberately become explicit, instead of waiting for the useful variability to appear on its own. That is what sets the number of samples.
The second contribution of Q14 is the control strategy: the organised set of controls, materials, process, critical parameters, in-process controls and final tests, that secures the quality of the product. An in-line measurement takes a place in it, and that place is described. Adding a sensor without updating that strategy adds a datum whose owner is undefined.
The model is frozen before the validation set is run
This is the boundary between building and demonstrating. Once the model is final it is locked, no further tuning, and its version, parameters, preprocessing and software are documented. The validation set is run only after that.
The reason fits in one sentence: if the model is adjusted after the validation results have been seen, the validation set has become a calibration set, and the demonstration no longer carries. The gap is invisible in the final report and legible in the version history, which is exactly where an auditor looks.
The domain of validity, and what happens outside it
This is the point on which a multivariate procedure defends itself. A model calibrated on samples always predicts something. Present it with material it has never seen, a new supplier, a deviated product, a fouled window, and it returns a value of normal appearance.
A procedure with out-of-domain detection is the defensible one. The tools exist and are expected: Mahalanobis distance in the model space, Hotelling’s T squared statistic, Q residuals on the unexplained part of the spectrum. Each answers a different question, whether the sample is extreme among those known, or of an unknown nature. Both are needed.
Two requirements follow, written into the method: justified alert thresholds, and a course of action when one is crossed, result set aside, confirmation sample, investigation. A diagnostic that feeds only a log protects a log. It is also what makes the life of the model possible over time, since without it a slow drift shows at release testing.
Qualification often covers the instrument at rest
Two qualifications complement each other. The protocols delivered with an instrument verify its wavelength accuracy, its photometry, its noise, on standards, at rest. The project covers the measurement of a product in motion, through a window, in running equipment: that second qualification is built on your line.
Closing it costs little when it is planned: a verification protocol in real conditions, run on the process, with samples paired in time and space and criteria written in advance. Ask the supplier for it. Where it does not exist, it is written, and well before the audit.
Two routes to acceptance, and the choice is made early
Replacing a test in place is demonstrated in two ways. They carry neither the same cost nor the same consequences, and the choice is made before the sampling campaign, because it changes the plan.
Either way, comparison with a reference procedure is expected. Ph. Eur. 5.25 writes it for in-line measurement: conventional validation procedures assume homogeneous and authentic samples, a condition rarely met on a process that changes during the measurement, and comparison with a reference test procedure would normally be needed. The same chapter asks that the causal relationship be demonstrated between the measurement, the model and the quality attribute where a trajectory or signature model is used for control.
Demonstrate equivalence
You show that the new procedure gives the same result as the one it replaces, on pairs taken from the same location in the same unit. The route is shorter. In exchange, the new procedure inherits the range, the limits and the uncertainty of the old one, the very one you often set out to retire.
Validate the procedure on its own
You run the full ICH Q2(R2) programme over several production batches, repeatability and intermediate precision included. The route is longer. In exchange the procedure stands on its own, and the test it replaces can be retired.
What a comparison demonstrates, and what equivalence asks for on top
A statistical test that finds no significant difference between the two procedures establishes something other than their equivalence: it says that with the data available, a difference could not be shown. On ten samples almost nothing is significant, which makes the argument comfortable and empty.
Equivalence is demonstrated the other way round. You declare in advance the gap you accept between the two procedures, you estimate the difference over the pairs, and you show that its confidence interval sits entirely inside that gap. The good news is right there: the acceptance margin is negotiated before the study, on product quality grounds, rather than after the results.
The plot of differences against the mean of the two procedures — the Bland-Altman plot — classically accompanies this demonstration. It shows at a glance a systematic bias, a bias that varies with level, and the points falling outside the limits of agreement.
Real time release testing: reachable, never automatic
Real time release testing concludes on the conformity of a batch from process data and in-process controls, rather than from a test on finished product. A legitimate objective, provided for in a dedicated text — the European guideline on real time release testing, EMA/CHMP/QWP/811210/2009-Rev1, in force since 1 October 2012 — and reached in industry. And never a consequence of installing a sensor.
What it assumes as a minimum, each point being a piece of work in itself:
- a procedure validated in the sense above
- process understanding sufficient to justify that the in-line measurement predicts the attribute of the finished product
- a sampling strategy that secures the representativeness of what is measured
- a documented control strategy
- deviation management
- regulatory approval
Once approved, it becomes the route to release
This is the point that decides the level of ambition, and it is written in the European guideline. An approved real time release testing scheme is used routinely to release batches. And where its result fails, or trends towards failure, end-product testing does not step in to rescue the batch: the text puts it that way.
What is expected instead is a contingency plan described in the dossier, for equipment failure. In other words, the third level does not add a net to the existing arrangement, it changes net. Knowing that before aiming at it beats discovering it at a review.
USP <905>: informing a test, and what substitution takes
Uniformity of dosage units is judged by a compendial test with a set number of units, a two-stage plan and numerical criteria. An in-line measurement can follow uniformity continuously, detect a drift well before the end of compression, set aside a doubtful segment. It informs the test and reduces the risk of non-conformity, and substitution rests on a demonstration of equivalence and a formal acceptance. Developed on the content uniformity page.
Frequently asked questions
Does the procedure need validating if it only steers?
In the formal sense, no. The installation is qualified, what the measurement does is described, and it is verified periodically that it still does it. The risk sits in ambiguity about the use rather than in the absence of validation, so write in black and white that the measurement carries no conformity decision.
How many samples does validating an in-line procedure take?
There is no universal number: a serious figure starts from the description of the process. What counts is coverage: the set holds the variability met in routine, the range of contents, raw material batches, seasons, operators. Thirty well spread samples serve better than two hundred taken on three consecutive batches.
What happens when the process changes after validation?
That falls to change management. A new raw material supplier, an equipment modification, an added strength can carry the procedure outside its domain. Out-of-domain detection is the first alert, the review of residuals the second. Revising a model is part of the project. Keeping a model alive.
Can a multivariate procedure be validated with no reference method?
For a model calibrated on samples, accuracy is established against a reference. A pure-component model depends on one less, and it calls for a known and declared composition. Its accuracy is still demonstrated on the real medium.
How long does a method validation project take?
It is not the technical part that sets the calendar, it is the wait for representative batches: where your process produces a difficult batch once a quarter, that wait is planned from the proof of concept rather than shortened by budget.
And if the validation concludes that the procedure needs another route?
It happens, and it is useful. A procedure that comes up short on robustness or specificity teaches you that the correlation seen in development rested on something other than expected. Better learnt in a validation report than in a non-conformity investigation, and the fallback is the level below, which stays fully usable.
What the authorities have already approved
The question comes back on every project aiming at release: does this actually get through? Public figures answer it without a promise.
In May 2026, the staff director of the Office of Pharmaceutical Quality at CDER stated, at the FDA’s regulatory education meeting, that the agency had approved seventeen products made by continuous manufacturing, the first in July 2015. The Emerging Technology Program, opened in 2014, had by then accepted one hundred and ninety-one submissions, seventy-two of them involving continuous manufacturing.
What those figures establish. Continuous manufacturing calls for a measurement that follows the product while it is being made: there is no end of operation at which to sample. Where those submissions were approved, process measurement is part of a control strategy the authority accepted. The question is no longer one of principle. It is one of dossier.
What they do not establish. Neither that your product is eligible, nor that the path is short. Seventeen approvals since 2015 is few, and each called for the work described on this page: a method developed, validated, documented, and a control strategy that holds. The figures say the door exists and that it opens, not that it opens quickly.
Source: Adam Fisher, Office of Pharmaceutical Quality, CDER, at the FDA Regulatory Education for Industry (REdI) meeting, reported by RAPS on 20 May 2026. We publish no list of products: the names circulate, and checking them one by one is work we have not done.
Tell us which decision the measurement has to support. You will know what its validation asks for.
Forty-five minutes is enough to place the realistic level of ambition, estimate the sample campaign it calls for, and spot the gaps an auditor would find in the file.