
Monday’s FOS/TAC describes Monday’s digester. Tuesday’s feed rate gets decided anyway. In between, the plant runs on judgement — and that gap is where overloads, acidification and lost weeks of production accumulate.
The three questions a digester asks
They do not concern the same material, they are not decided on the same timescale, and they do not call for the same measurement. A page that mixes them up helps no one.
What am I feeding today?
The feedstock. A maize silo does not hold the same dry matter in November and in May, and a load of biowaste varies from one truck to the next. The ration is still calculated on a single figure. This is the most accessible measurement of the three, and the one that decides everything downstream.
Is the digester coping?
The medium. FOS/TAC, volatile fatty acids, ammonium. An imbalance settles in over days and takes weeks to recover from. This is the most useful question and the hardest to instrument — a dark, loaded, heterogeneous medium, often in a classified area.
What is the digestate worth?
The output. Dry matter, nitrogen, agronomic value. This is a question of valorisation more than of process control, but it reads on the same signal — and often more easily, because the material is more stable by then.
What near infrared measures, what it indicates, and what it does not do
This is the question to settle before any other, and the literature of the field has been answering it for close to twenty years. Every figure on this page comes from published work — none of it comes from our own trials. It is owed to Danish, German and British teams, and each section cites its sources.
| Quantity | What to expect from it | What the published work shows |
|---|---|---|
| Dry matter, volatile solids, ammonium | A measurement | Modelled with a single component, coefficient of determination 0.98. A single one: that is the signature of a direct spectral relationship, not of a fit |
| Total VFA, acetic acid | A trend indicator | Six components, prediction error of the order of 17 % of the range, validated on an independent test set |
| Minor individual VFA — valeric, iso-butyric | Nothing reliable | Coefficients of 0.41 and 0.38. The authors add that more samples would change nothing: the residual variance is already in the data |
FOS/TAC is not a chemical species
It is the ratio of two titration end points. Predicting a FOS/TAC by spectroscopy means predicting the result of a method, not the concentration of a molecule. That is not disqualifying — the literature does it under the names bicarbonate alkalinity and total buffering capacity — but it needs saying. A model aimed at a conventional indicator inherits the conditions of the reference analysis, drift included.
In a digestate, several quantities are sometimes one
The correlations measured before any prediction are published: dry matter and volatile solids at 1.00, dry matter and ammonium at 0.97, dry matter and total VFA at 0.61. A model that predicts ammonium may legitimately be predicting nothing but dry matter. This is specificity in the sense of ICH Q2(R2), and it is the criterion most often skimped on. On a digester, the day the correlation breaks is precisely the day of the incident the measurement was there to announce.
Feedstock: what goes in decides everything else
This is the most mature area, and it holds a surprise. On the prediction of the biochemical methane potential of a biomass, three independent teams — on reed canary grass, on maize, and on a broad panel of plant biomasses — reach the same conclusion: models built on the spectrum predict methane potential better than models built on chemical composition. That is, better than the full analytical route.
For a plant operator the consequence is immediate: the question “is this load worth feeding?” can be asked before feeding, rather than three weeks later, off the gas meter.
Silage, the special case, and a common one
A silo is not one material, it is a series. Dry matter shifts from the working face to the back, from one cut to the next, from one year to another. Two German studies address exactly this: feed substrate quality monitored in line at full scale, and the biogas yield of maize silage.
And a reservation we carry over unchanged
One of those studies concludes that the benefit of continuous prediction of substrate potential could not be demonstrated — because substrate quality was too stable over the trial period. It is an honest reservation, and a general one: a measurement only proves its worth where there is variability to see. If your feedstock does not move, in-line measurement has nothing to teach you about it. If your feedstock moves and you cannot see it, the reverse holds.
References: T.P. Kandel et al., Bioresour. Technol. 146 (2013) 282-287; C. Grieder et al., J. Near Infrared Spectrosc. 19 (2011) 463-477; B. Godin, F. Mayer, R. Agneessens, P. Gerin, P. Dardenne, P. Delfosse and J. Delcarte, Bioresour. Technol. 175 (2015) 382-390; H.F. Jacobi, C.R. Moschner and E. Hartung, Bioresour. Technol. 102 (2011) 4688-4696; H.F. Jacobi, S. Ohl, E. Thiessen and E. Hartung, Bioresour. Technol. 103 (2012) 162-172.
What the literature also publishes when it does not work
A page that lines up nothing but successes gets taken apart by the first operator who has already tried. So here is the trial that concludes the method falls short, and why it is the most instructive of the four we cite.
On a 150 litre pilot fitted with a diffuse reflectance probe on a recirculation loop, a Danish team obtains on total VFA a performance-to-deviation ratio of 1.8 — below the threshold of 2.5 generally held to be the minimum for quantitative analysis. The authors’ conclusion, word for word: near infrared gives an approximate indication of liquid phase concentrations.
Why this trial scores lower than another, and what that teaches
Because it deliberately pushed the process. Organic loading was raised in six steps to an extreme overload, and VFA sweep the whole range from 0 to 9.4 g/L. The models that show better figures were built over narrower ranges.
A model calibrated under nominal operation has never seen an incident — and the incident is exactly what the measurement is there to announce. It is the span of the reference set that makes the difference, far more than the sophistication of the data treatment. We would rather say so before a trial than after.
A.J. Ward, E. Bruni, M.K. Lykkegaard, A. Feilberg, A.P.S. Adamsen, A.P. Jensen and A.K. Poulsen, Bioresource Technology 102 (2011) 4098-4103.
Our in-line installation
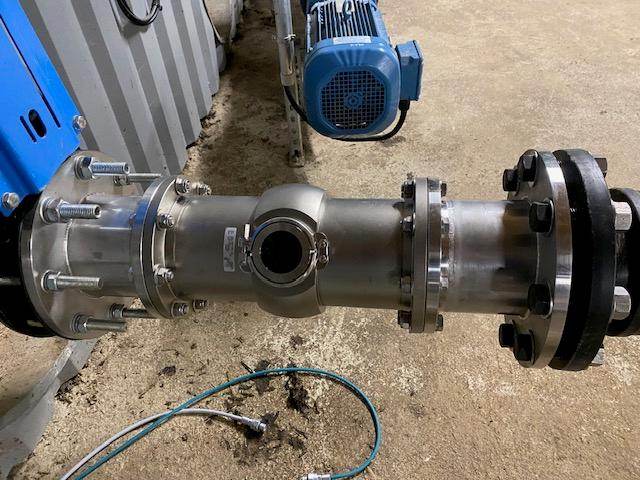
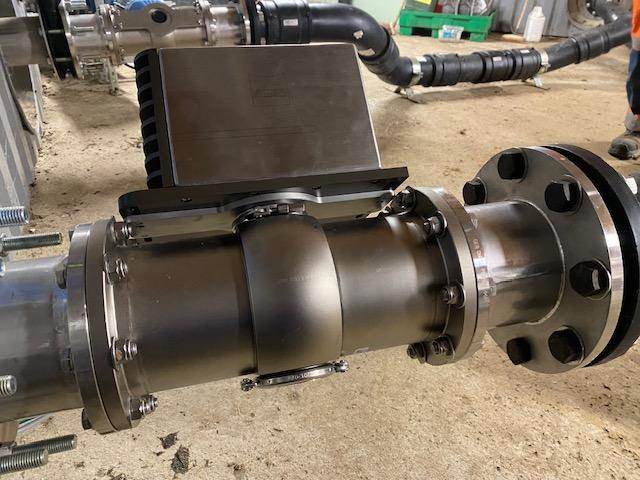
A near infrared probe has been installed in line on a working digester since 2025, on a flanged spool fitted to the recirculation loop, acquiring continuously in reflectance between 950 and 1650 nanometres. The two photographs at the top of this page are of that installation.
The feasibility study is ongoing, as part of a client project. The quantities tracked, the results obtained and the process observations belong to the operator: we publish none of them. What we can say on our own account fits in one sentence — the installation holds up over time in a real medium, which is the first question this kind of installation raises, and the one most often underestimated.
What we do not publish, and why
No prediction performance is published to date — no measurement range, no prediction error, on any of the quantities tracked. Two reasons, and the second would hold even without the first. The data of a working digester belongs to its operator. But even if it were free to publish: a performance figure is only worth the span over which it was established. That is exactly what the trial cited above demonstrates — a modest result, precisely because it covered the whole range up to overload, where a trial run over a narrow range would have shown better and proved less. We apply the same rule here as to water content measured through the packaging: feasibility can be stated, performance has to be demonstrated.
Conditions for success, and limits
A window sees a few tenths of a square centimetre
One published trial puts a number on it: the probe illuminates about 0.1 cm², and at a bend in the loop, gas or a large particle can become trapped in front of the window and corrupt the reading. Against that, the reference analysis is run on tens of grams. The difference in scale is not an abstraction, it is a ratio of volumes — and it is the first thing to deal with. See sampling and representativeness.
Area classification drives the choice, and cannot be retrofitted
Zone, type of protection, type of connection: these decisions determine which instrument is available and how it can be installed. They are taken at scoping, not at purchase order. Feasibility demonstrated with a laboratory instrument says nothing about what will be installable on your site.
The medium changes all year
A digester fed on silage in winter and on grass in spring is not the same medium. A model built over one season is verified over the next — that is a condition, not a precaution. See keeping a model alive.
What in-line measurement does not replace
FOS/TAC titration and laboratory analysis remain the reference, and they are what the model is built on. In-line measurement does not replace them: it fills the interval between two of them. It tells you when an analysis is worth bringing forward, and when the ration can run on.
What you need to have in place
- A frozen reference method, and the same laboratory throughout the build phase. Changing titration protocol midway invalidates the calibration set.
- Paired sampling: sample at the measurement point, at the moment of acquisition, and record the time. A few hours’ offset on a digester is a real offset.
- Variability, or the time to wait for it. This is the point that decides everything: a reference set covering three levels does not allow a performance to be claimed, whatever data treatment is applied.
- The area classification, before any discussion of instruments.
Frequently asked questions
Can FOS/TAC be tracked in line?
What can be tracked is a prediction of FOS/TAC, and the distinction matters. FOS/TAC is the ratio of two titration end points: what the model learns is the outcome of that analysis, with its conditions and its drift. The literature publishes models of bicarbonate alkalinity and total buffering capacity on real plants, so the thing is feasible. What has to be checked case by case is whether the model genuinely predicts the indicator, or predicts it through its correlation with dry matter.
How long before a usable model?
The question is not how long, but how much variability has been encountered. A perfectly stable digester over six months gives a model less to work with than one that goes through two feedstock changes in six weeks. That is why the build starts with an acquisition phase with no model at all, during which you watch what the signal does and what the process does.
Does the plant have to stop for the measurement to be fitted?
Fitting a flanged spool into a recirculation loop is done during a planned shutdown, and the spool can be prepared in advance. It is a point to scope early, because it governs the schedule far more than the instrument does.
Does the measurement replace laboratory analysis?
No, and that is not the aim. The laboratory remains the reference the model is built on and checked against. In-line measurement informs the interval between two analyses, and flags when one is worth bringing forward.
What about the digestate on the way out?
That is often the most favourable case: the material is more homogeneous than mid-digestion, and the quantities of interest — dry matter, organic matter, nitrogen — are precisely the ones the literature models best, with very few components.
Tell us what your digester has already cost you in weeks of production.
Forty-five minutes is enough to place your plant: what in-line measurement could see there, what it will not see, and what would need observing on your site before committing to anything. A reply by email works just as well if you would rather write.